
Abstract
Over the past few decades, global labor markets have seen significant shifts, with an increasing proportion of workers attaining secondary education or higher. However, countries like Moldova are experiencing an aging workforce, reflected in its 44.1-year average age for workers aged 15-64 with secondary education or higher. This trend highlights broader demographic shifts, including declining birth rates and increased life expectancy, leading to a higher proportion of older workers in the labor force. Such trends often challenge productivity and economic growth, necessitating policies to support an aging workforce.
Workers aged 15-64 with secondary education or higher, average age
From 1981 to 2021, the average age of workers with secondary education or higher globally has steadily increased, reflecting broader demographic shifts. Moldova reached its peak in 2018 at 45.3 years, with a current average age at 97.3% of that peak. This aging workforce is a result of declining birth rates, longer life expectancy, and slower labor force entry for younger generations. As older workers remain employed longer, countries face challenges such as skill gaps, slower workforce renewal, and potential impacts on productivity, requiring policy adaptations to address an aging labor force.
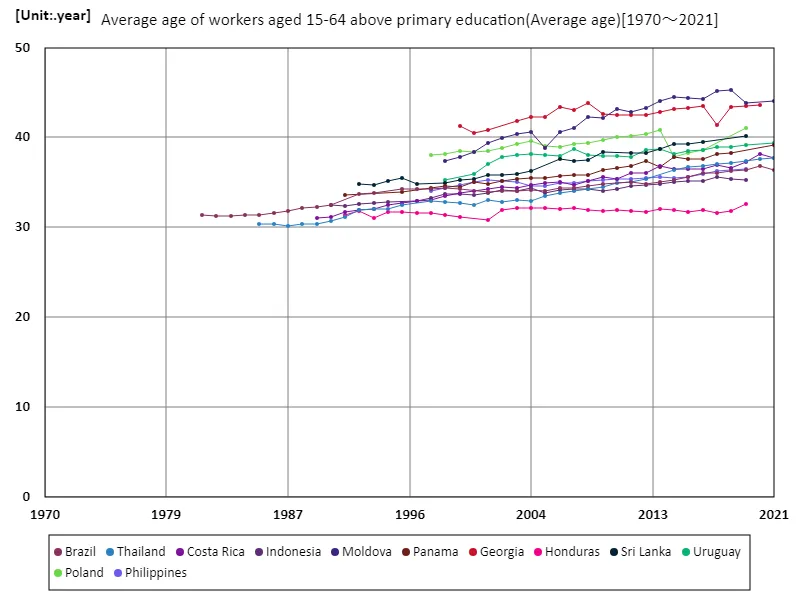
The maximum is 45.3year[2018] of Moldova, and the current value is about 97.3%
Average age of workers aged 15-64 with secondary education or higher (worldwide)
Between 1981 and 2021, the average age of workers with secondary education or higher has steadily risen globally, reflecting demographic changes such as lower birth rates and increased life expectancy. Latvia reached its peak average age of 45.5 years in 2016, with its current age at 100% of that peak. This trend underscores the aging workforce, as older workers stay employed longer while younger workers enter the labor force later. As a result, Latvia faces challenges related to productivity, skill gaps, and an evolving labor market, necessitating policies to support an aging, dynamic workforce.
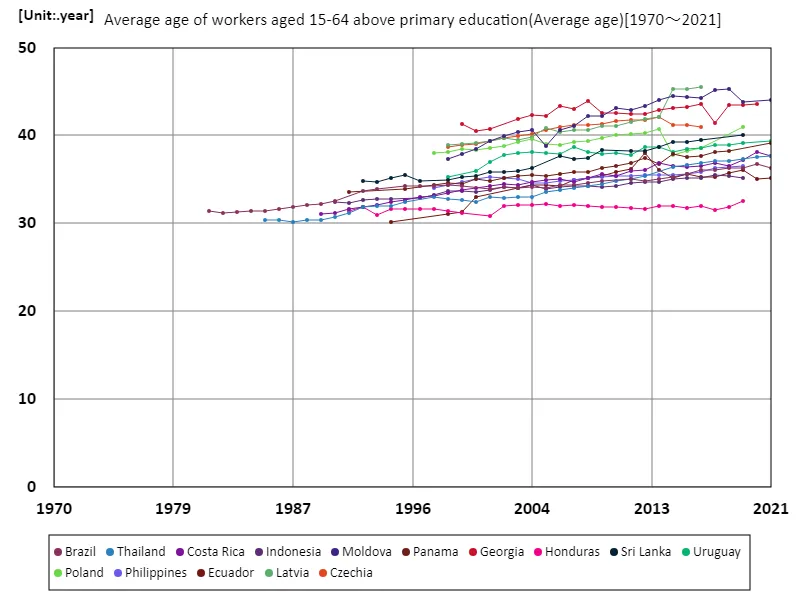
The maximum is the latest one, 45.5year of Latvia
Workers aged 15-64 with secondary education or higher, average age (world countries, latest year)
As of 2021, Moldova has the highest average age of workers with secondary education or higher, at 44.1 years, compared to a global average of 36.7 years. This reflects the aging workforce trend, driven by lower birth rates, increased life expectancy, and delayed labor market entry for younger generations. The cumulative effect is a workforce with a total of 586 years on average, highlighting the growing reliance on older workers. As countries like Moldova experience demographic shifts, there is an increasing need for policies that support both older workers and workforce renewal to maintain economic growth and productivity.
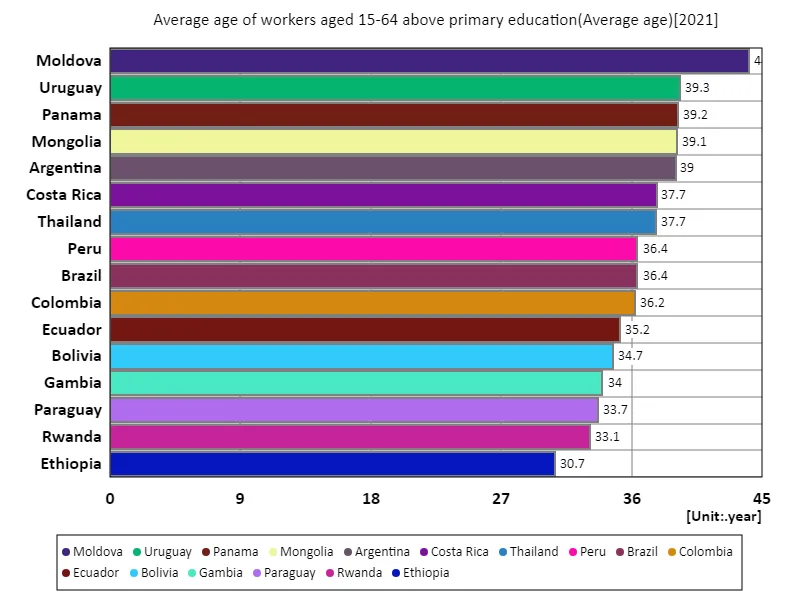
The maximum is 44.1year of Moldova, the average is 36.7year, and the total is 586year
Main data
| Average age of workers aged 15-64 above primary education(Average age) [year] | ||||||||||
|---|---|---|---|---|---|---|---|---|---|---|
| Hungary | Finland | Sweden | Bulgaria | Croatia | Latvia | Lithuania | Netherlands | Estonia | Slovakia | |
| 2021 | ||||||||||
| 2020 | ||||||||||
| 2019 | ||||||||||
| 2018 | ||||||||||
| 2017 | ||||||||||
| 2016 | 46.52 | 46.4 | 45.74 | 45.61 | 45.46 | 45.46 | 45.15 | 45.11 | 45.11 | 45.06 |
| 2015 | 46.15 | 46.03 | 45.83 | 45.78 | 45.16 | 45.33 | 44.9 | 44.71 | 44.94 | 45.01 |
| 2014 | 45.86 | 46.03 | 45.66 | 45.48 | 45.32 | 45.33 | 44.81 | 44.77 | 44.74 | 45.19 |
| 2013 | 43.14 | 43.02 | 42.66 | 42.97 | 41.41 | 42.13 | 42.21 | 42.34 | 41.71 | 41.88 |
| 2012 | 42.65 | 43.33 | 42.29 | 42.66 | 40.91 | 41.92 | 42.27 | 42.2 | 41.87 | 41.68 |
| 2011 | 42.47 | 43.22 | 42.34 | 42 | 42.02 | 41.57 | 41.52 | 42 | 41.83 | 41.54 |
| 2010 | 42.14 | 43.4 | 42.16 | 41.89 | 41.1 | 41.54 | 41.81 | 41.92 | 41.2 | |
| 2009 | 41.56 | 42.89 | 42.13 | 41.43 | 41.11 | 41.26 | 41.66 | 41.77 | 40.93 | |
| 2008 | 40.27 | 42.71 | 42.11 | 40.57 | 40.8 | 41.37 | 41.15 | 40.44 | ||
| 2007 | 40.31 | 41.56 | 41.97 | 40.67 | 40.61 | 40.93 | 41.01 | 40.59 | ||
| 2006 | 39.91 | 42.4 | 41.9 | 40.65 | 40.36 | 40.63 | 40.5 | 41.19 | 40.01 | |
| 2005 | 42.53 | 42.29 | 40.52 | 40.83 | 40.49 | 40.26 | 41.23 | 39.87 | ||
| 2004 | 40.06 | 42.89 | 42.33 | 40.32 | 39.85 | 38.59 | 38.27 | 40.87 | 38.38 | |
| 2003 | 39.87 | 39.48 | 38.07 | 38.03 | 40.17 | 38.18 | ||||
| 2002 | 39.28 | 39.97 | 39.76 | 37.87 | 40.45 | 38.08 | ||||
| 2001 | 38.94 | 39.35 | 39.83 | 37.54 | 40.19 | 38.01 | ||||
| 2000 | 39.17 | 40.09 | 37.34 | 40.09 | 37.82 | |||||
| 1999 | 39.02 | 39.48 | 37.08 | 37.56 | ||||||
| 1998 | 39.13 | 38.89 | 38.76 | 39.86 | 37.24 | |||||
| 1997 | ||||||||||
| 1996 | ||||||||||
| 1995 | ||||||||||
| 1994 | ||||||||||
| 1993 | ||||||||||
| 1992 | ||||||||||
| 1991 | ||||||||||
| 1990 | ||||||||||
| 1989 | ||||||||||
| 1988 | ||||||||||
| 1987 | ||||||||||
| 1986 | ||||||||||
| 1985 | ||||||||||
| 1984 | ||||||||||
| 1983 | ||||||||||
| 1982 | ||||||||||
| 1981 | ||||||||||
| 1980 | ||||||||||
| 1970 | ||||||||||


Comments