Abstract
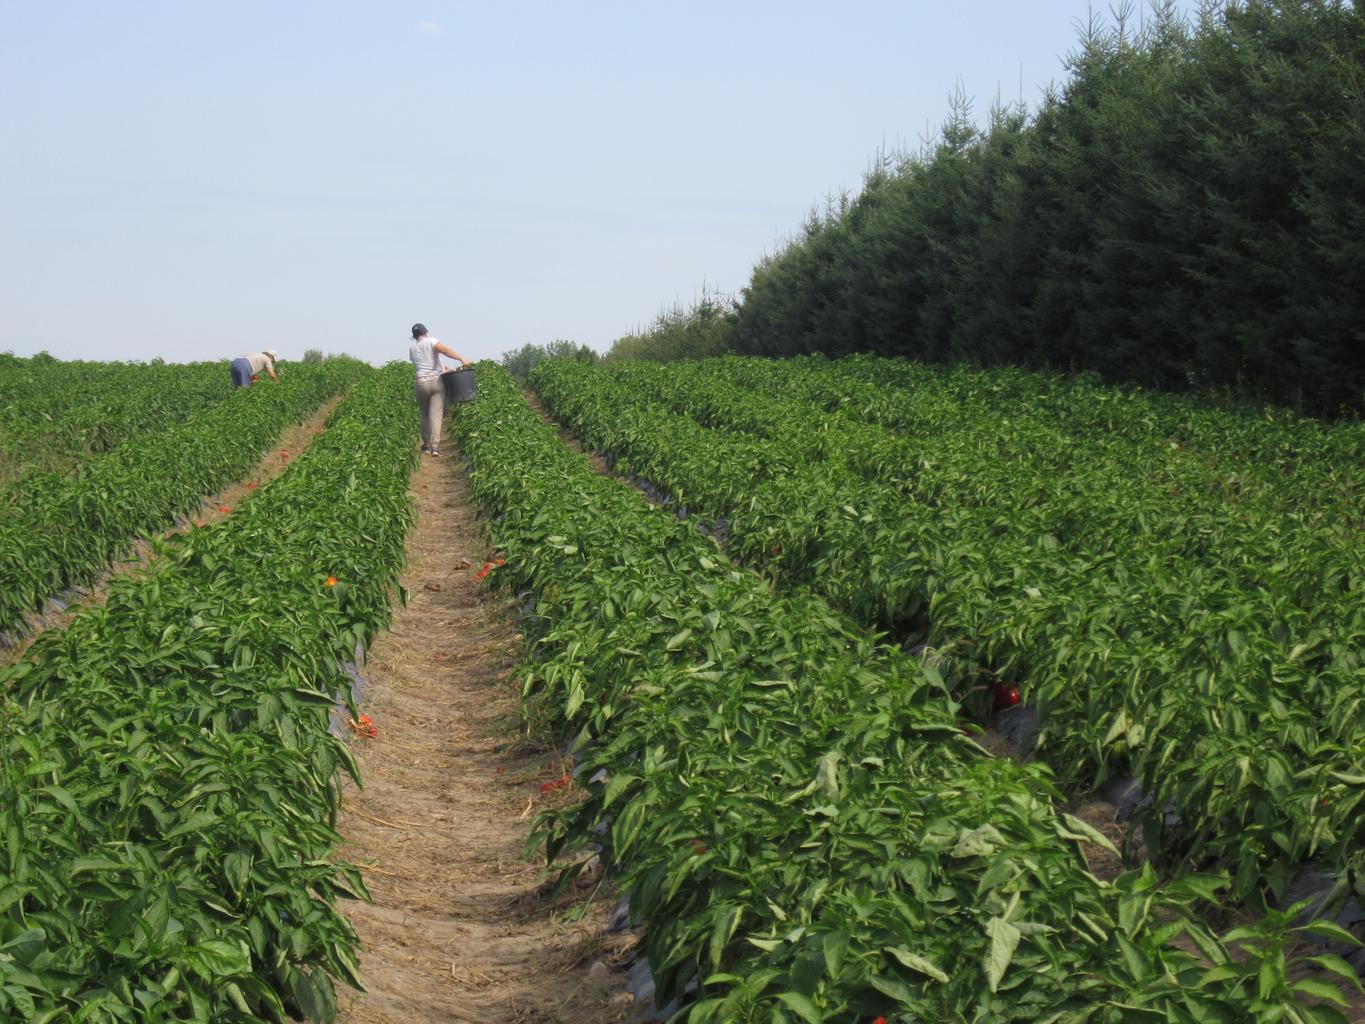
In recent decades, the agricultural sector has seen a gradual aging of its workforce, particularly in countries like Thailand, where the average age of workers aged 15-64 reached 45.5 years in 2021. This trend reflects broader global patterns, with younger generations increasingly moving to urban areas for better job prospects in technology and services. As a result, many agricultural sectors face challenges in maintaining labor forces, leading to a reliance on older workers and, in some cases, a decrease in agricultural productivity. Efforts to modernize and mechanize agriculture are critical to address these demographic shifts.
Agriculture sector, workers aged 15-64, average age
From 1980 to 2021, the global agricultural workforce has steadily aged, with Moldova reaching the highest average age of 48.1 years in 2018. This trend reflects a broader shift in the sector, where younger workers increasingly migrate to urban areas for better opportunities, leaving behind an aging workforce. As of 2021, Moldova’s agricultural workers are at 94.4% of their peak age, highlighting a slower decline compared to other regions. These aging trends underscore the need for modernization, mechanization, and policies to attract younger generations to sustain agricultural productivity.
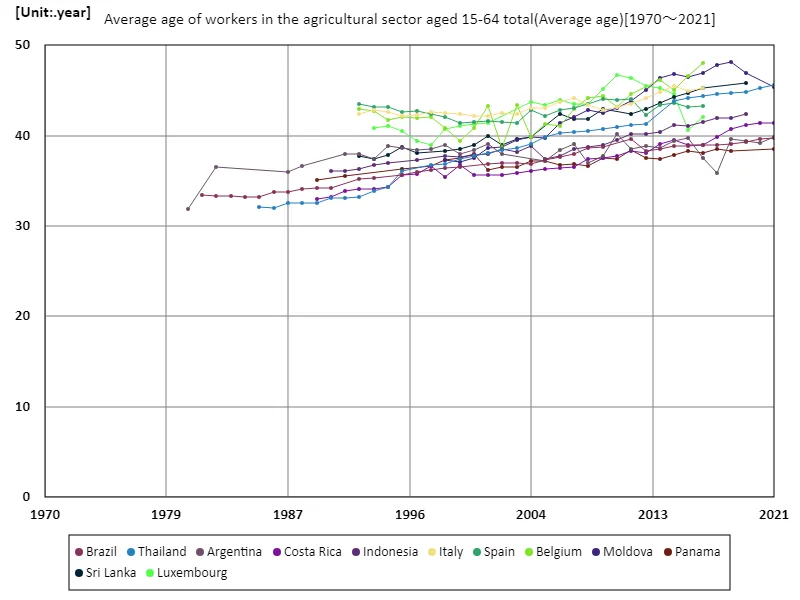
The maximum is 48.1year[2018] of Moldova, and the current value is about 94.4%
Agriculture sector, workers aged 15-64, average age (worldwide)
Between 1980 and 2021, the agricultural sector globally has experienced an aging workforce, with Moldova reaching the highest average age of 48.1 years in 2018. As of 2021, Moldova’s agricultural workers are at 94.4% of their peak age, reflecting a persistent trend of an older workforce. This aging is driven by younger generations leaving rural areas for urban employment in other sectors. The trend highlights challenges in maintaining labor supply and productivity in agriculture, emphasizing the need for innovation, mechanization, and strategies to attract younger workers to the sector.
The maximum is 48.1year[2018] of Moldova, and the current value is about 94.4%
Agriculture sector, workers aged 15-64, average age (worldwide, latest year)
As of 2021, the agricultural workforce globally shows signs of aging, with Thailand having the highest average age at 45.5 years. The global average age in the sector is 39.5 years, reflecting a trend of older workers in agriculture. This aging workforce is a result of younger generations increasingly moving to urban areas for better job opportunities. The sector faces challenges in maintaining a sustainable labor force, leading to a need for modernization, mechanization, and policies to attract younger workers to ensure continued productivity and growth in agriculture.
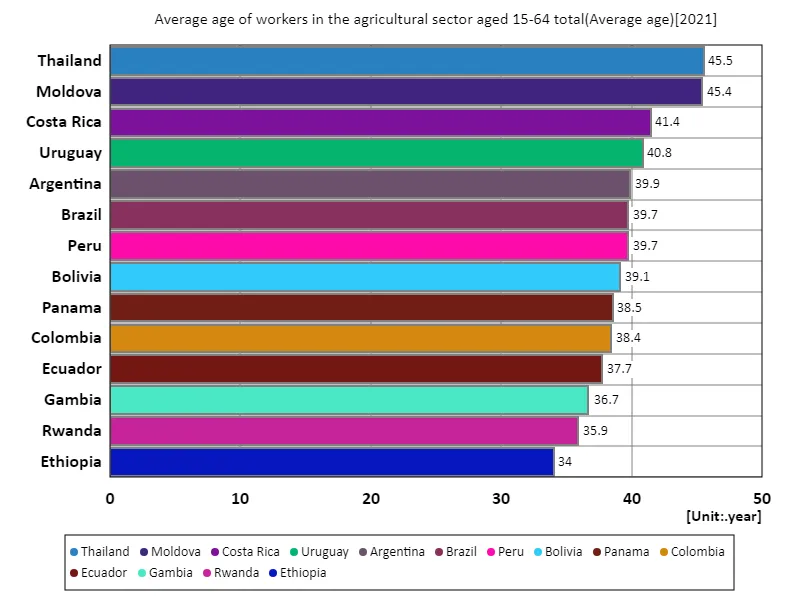
The maximum is 45.5year of Thailand, the average is 39.5year, and the total is 553year
Main data
| Average age of workers in the agricultural sector aged 15-64 total(Average age) [year] | ||||||||||
|---|---|---|---|---|---|---|---|---|---|---|
| Korea | Greece | Ireland | Belgium | Portugal | Moldova | Cyprus | Finland | Sweden | Saint Lucia | |
| 2021 | 45.39 | |||||||||
| 2020 | ||||||||||
| 2019 | 46.97 | |||||||||
| 2018 | 53.15 | 48.1 | ||||||||
| 2017 | 53.17 | 47.84 | ||||||||
| 2016 | 52.88 | 48.24 | 48.09 | 48.04 | 47.34 | 46.95 | 46.54 | 46.52 | 46.09 | 46.06 |
| 2015 | 53 | 47.59 | 48.91 | 46.55 | 46.95 | 46.54 | 41.21 | 45.57 | 46.9 | |
| 2014 | 52.36 | 47.29 | 47.81 | 45.1 | 46.13 | 46.79 | 43.47 | 45.67 | 45.56 | |
| 2013 | 52.32 | 47.08 | 49.74 | 46.15 | 47.25 | 46.4 | 45.4 | 45.42 | 47.73 | |
| 2012 | 52.4 | 47.77 | 47.03 | 45.05 | 47.89 | 45.62 | 46.34 | |||
| 2011 | 51.54 | 47.26 | 44.63 | 48.15 | 43.84 | 48.48 | 46.95 | 46.59 | ||
| 2010 | 52.16 | 46.63 | 43.15 | 47.93 | 43.1 | 46.56 | 42.84 | |||
| 2009 | 52.12 | 46.4 | 48.81 | 44.42 | 48.11 | 42.54 | 46.31 | 46.47 | 43.04 | |
| 2008 | 52.19 | 46.49 | 48.94 | 44.22 | 49.17 | 42.79 | 45.53 | 47 | 45.26 | |
| 2007 | 46.47 | 46.63 | 42.92 | 47.47 | 42.11 | 45.32 | 45.8 | 44.93 | ||
| 2006 | 52 | 45.47 | 45.8 | 41.09 | 48.17 | 41.39 | 45.24 | 46.92 | 44.25 | |
| 2005 | 51.28 | 45.77 | 44.55 | 41.32 | 48.23 | 39.7 | 45.41 | 48.06 | 44.33 | |
| 2004 | 51.1 | 45.07 | 47.15 | 39.83 | 47.77 | 39.84 | 46.4 | 42.77 | ||
| 2003 | 51.25 | 43.39 | 39.52 | |||||||
| 2002 | 50.69 | 38.61 | 38.77 | |||||||
| 2001 | 43.32 | 38.59 | ||||||||
| 2000 | 40.81 | 37.48 | ||||||||
| 1999 | 39.41 | 37.09 | ||||||||
| 1998 | 40.79 | 37.35 | 43.55 | |||||||
| 1997 | 42.06 | 41.85 | ||||||||
| 1996 | 41.95 | 43.38 | ||||||||
| 1995 | 42.11 | 42.75 | ||||||||
| 1994 | 41.74 | |||||||||
| 1993 | 42.67 | |||||||||
| 1992 | 42.94 | |||||||||
| 1991 | ||||||||||
| 1990 | ||||||||||
| 1989 | ||||||||||
| 1988 | ||||||||||
| 1987 | ||||||||||
| 1986 | ||||||||||
| 1985 | ||||||||||
| 1984 | ||||||||||
| 1983 | ||||||||||
| 1982 | ||||||||||
| 1981 | ||||||||||
| 1980 | ||||||||||
| 1970 | ||||||||||


Comments