Abstract
In recent decades, many countries have experienced aging workforces, driven by declining birth rates and increased life expectancy. Moldova, with an average worker age of 44.1 years in 2021, reflects this broader global trend. As populations age, there are fewer younger workers entering the labor market, putting pressure on pension systems and healthcare. Older workers often stay in employment longer, though they may face challenges in adapting to technological changes. The trend highlights the need for policies to support workforce participation across age groups and ensure economic sustainability.
Workers aged 15-64, average age
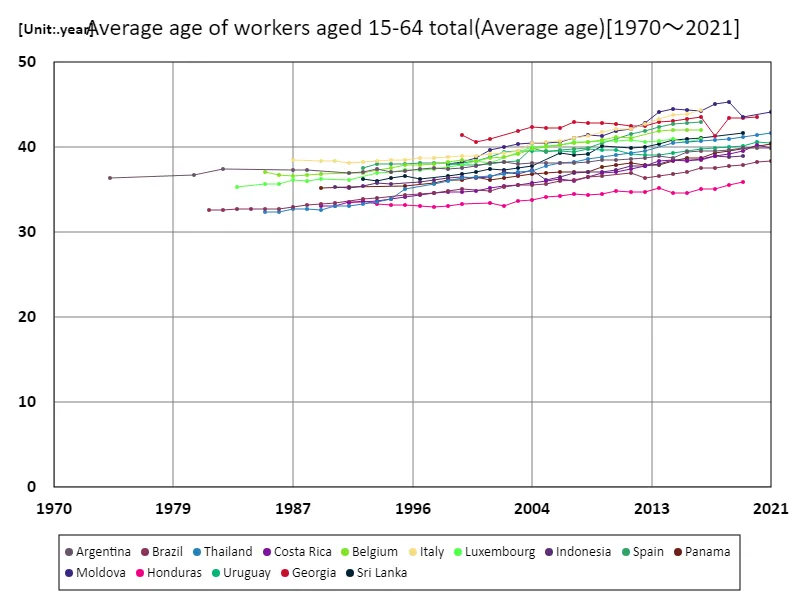
Moldova’s workforce, with an average age of 45.2 years in 2018, reflects a broader global trend of aging populations. As of 2021, Moldova’s worker age stands at 97.4% of its peak, signaling a slowly aging workforce. This trend is driven by lower birth rates, longer life expectancy, and a shrinking youth population entering the labor market. Older workers are remaining in employment longer, which can strain pension systems and healthcare services. The shift necessitates policies that promote workforce participation across all age groups and encourage adaptability to technological changes.
The maximum is 45.2year[2018] of Moldova, and the current value is about 97.4%
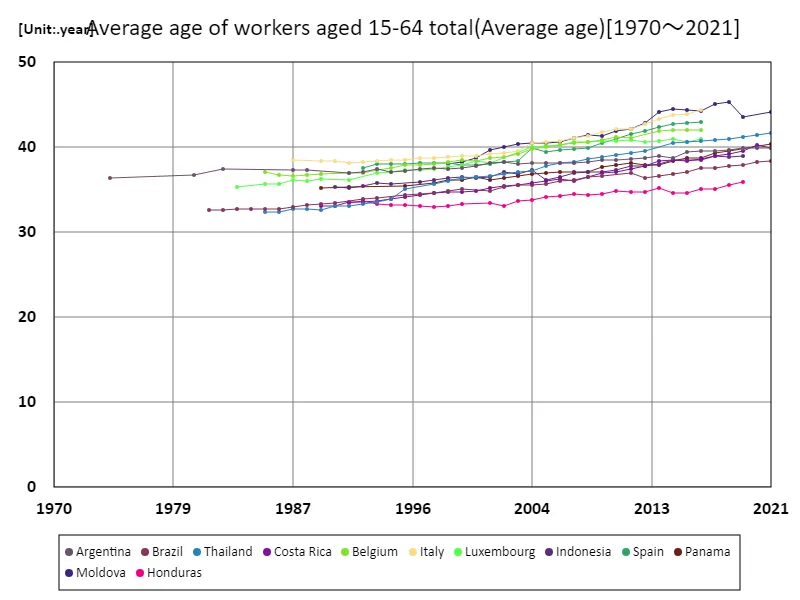
Average age of workers aged 15-64 (worldwide)
Moldova’s workforce age reached its peak of 45.2 years in 2018, reflecting a global trend of aging populations. By 2021, it stood at 97.4% of this peak, highlighting a steadily aging workforce. This shift is driven by declining birth rates, increased life expectancy, and fewer young workers entering the labor market. As older workers remain employed longer, economic systems face pressures, particularly in pensions and healthcare. Adapting to these demographic changes requires policies that support longer workforce participation and technological adaptability across all age groups.
The maximum is 45.2year[2018] of Moldova, and the current value is about 97.4%
Workers aged 15-64, average age (world, latest year)
As of 2021, Moldova has the highest average worker age among countries, at 44.1 years, surpassing the global average of 38.6 years. This reflects a broader trend of aging workforces, driven by declining birth rates and longer life expectancy. In Moldova, the labor force is experiencing a shift with fewer younger workers entering the job market, placing strain on pension systems and healthcare. The trend underscores the need for policies that encourage workforce participation across all age groups and provide support for older workers to adapt to evolving job demands.
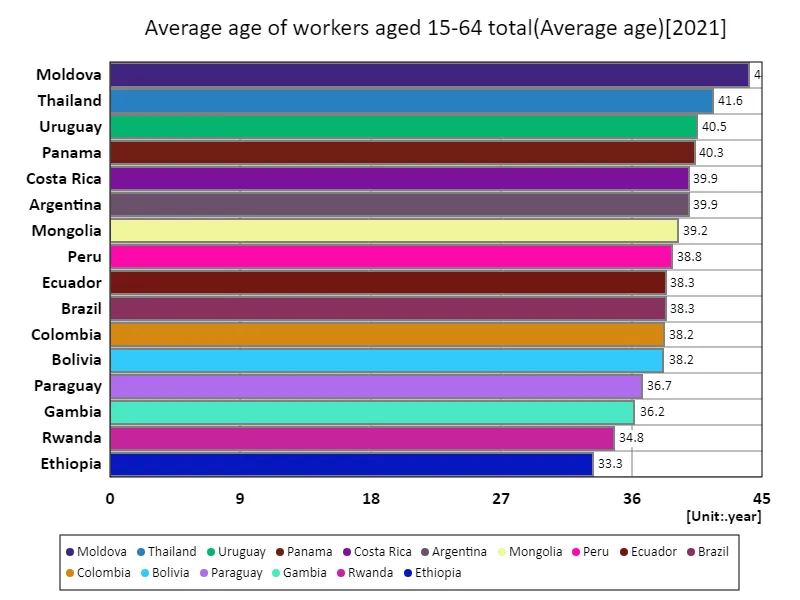
The maximum is 44.1year of Moldova, the average is 38.6year, and the total is 618year
Main data
| Average age of workers aged 15-64 total(Average age) [year] | ||||||||||
|---|---|---|---|---|---|---|---|---|---|---|
| Italy | Moldova | Denmark | Georgia | Finland | Hungary | Norway | Spain | Greece | Lithuania | |
| 2021 | 44.07 | |||||||||
| 2020 | 43.58 | |||||||||
| 2019 | 43.47 | 43.46 | ||||||||
| 2018 | 45.25 | 43.36 | ||||||||
| 2017 | 45.1 | 41.35 | ||||||||
| 2016 | 44.3 | 44.26 | 43.7 | 43.54 | 43.45 | 43.27 | 43.02 | 42.99 | 42.96 | 42.96 |
| 2015 | 43.87 | 44.38 | 43.69 | 43.24 | 43.28 | 43.21 | 43.11 | 42.81 | 42.63 | 42.49 |
| 2014 | 43.72 | 44.45 | 43.54 | 43.1 | 43.05 | 43.25 | 43.14 | 42.68 | 42.45 | 42.41 |
| 2013 | 43.24 | 44.06 | 43.45 | 42.92 | 43 | 43.13 | 42.59 | 42.33 | 42.37 | 42.25 |
| 2012 | 42.66 | 42.85 | 42.86 | 42.47 | 43.27 | 42.65 | 42.99 | 41.88 | 42.07 | 42.26 |
| 2011 | 42.08 | 42.13 | 43.08 | 42.45 | 43.15 | 42.47 | 43.01 | 41.52 | 41.65 | 41.42 |
| 2010 | 42.05 | 41.93 | 43.13 | 42.7 | 43.34 | 42.18 | 42.54 | 40.96 | 41.62 | 41.49 |
| 2009 | 41.7 | 41.3 | 42.46 | 42.81 | 42.85 | 41.59 | 42.2 | 40.49 | 41.41 | 41.25 |
| 2008 | 41.34 | 41.45 | 42.39 | 42.82 | 42.65 | 40.31 | 42.14 | 39.94 | 41.17 | 40.79 |
| 2007 | 41 | 41.07 | 42.44 | 42.99 | 42.48 | 40.33 | 42.48 | 39.81 | 40.99 | 40.62 |
| 2006 | 40.73 | 40.6 | 42.56 | 42.24 | 42.35 | 39.92 | 42.49 | 39.65 | 40.67 | 40.64 |
| 2005 | 40.63 | 40.42 | 42.3 | 42.24 | 42.47 | 40.97 | 42.07 | 39.45 | 40.62 | 40.53 |
| 2004 | 40.42 | 40.45 | 42.38 | 42.37 | 42.83 | 40.04 | 41.93 | 39.86 | 40.45 | 39.58 |
| 2003 | 39.48 | 40.34 | 41.92 | 39.91 | 38.33 | 39.72 | ||||
| 2002 | 39.33 | 39.96 | 39.48 | 38.18 | ||||||
| 2001 | 39.13 | 39.65 | 40.91 | 39.26 | 38.02 | 40.24 | ||||
| 2000 | 38.99 | 38.68 | 40.62 | 37.87 | 40.78 | |||||
| 1999 | 38.92 | 38.27 | 41.4 | 37.87 | 40.34 | |||||
| 1998 | 38.82 | 37.95 | 39.77 | 38.13 | 39.85 | |||||
| 1997 | 38.74 | 39.58 | 38.15 | |||||||
| 1996 | 38.65 | 39.49 | 38.13 | |||||||
| 1995 | 38.51 | 39.35 | 37.99 | |||||||
| 1994 | 38.49 | 38.02 | ||||||||
| 1993 | 38.33 | 37.8 | 38.04 | |||||||
| 1992 | 38.24 | 37.59 | 37.58 | |||||||
| 1991 | 38.06 | 37.28 | ||||||||
| 1990 | 38.37 | |||||||||
| 1989 | 38.38 | |||||||||
| 1988 | ||||||||||
| 1987 | 38.51 | |||||||||
| 1986 | ||||||||||
| 1985 | ||||||||||
| 1984 | 39.9 | |||||||||
| 1983 | ||||||||||
| 1982 | ||||||||||
| 1981 | ||||||||||
| 1980 | ||||||||||
| 1974 | ||||||||||
| 1970 | ||||||||||


Comments