
- Abstract
- Service sector, workers aged 15-64 with primary education or less, average age
- Services sector, workers aged 15-64 with primary education or less, average age (worldwide)
- Services sector, workers aged 15-64 with primary education or less, average age (world countries, latest year)
- Main data
- Reference
Abstract
Over the years, the global economy has seen a growing reliance on service sector workers, including those with primary school education or less. Among workers aged 15-64 in this group, Peru stands out with the highest average age of 47.5 years as of 2021. This trend highlights aging labor forces in many nations, especially in less-skilled sectors. The combination of limited education and increasing age suggests challenges in workforce adaptability and productivity. It reflects broader issues such as slower educational improvements, limited access to training, and demographic shifts influencing labor market dynamics.
Service sector, workers aged 15-64 with primary education or less, average age
From 1981 to 2021, the global service sector has seen a gradual aging of its workforce, particularly among workers aged 15-64 with primary school education or less. Italy marked a peak in 2015 with an average age of 52.1 years, reflecting demographic aging and economic shifts. Currently, Italy remains near this high at 96.8% of its peak, highlighting persistent reliance on older, less-educated workers in the sector. This trend signals challenges in workforce renewal and adaptation, driven by declining birth rates, extended working lives, and limited integration of younger, better-educated workers into these roles, underscoring the need for targeted education and training policies.
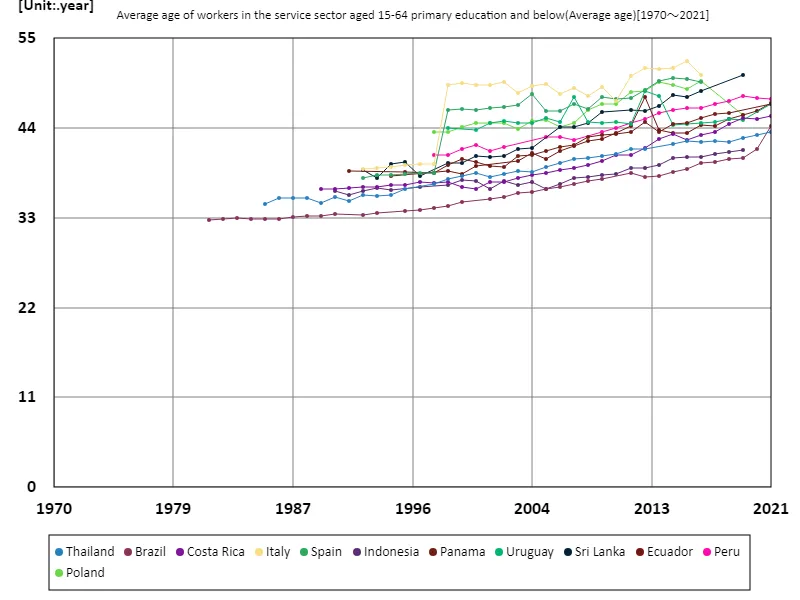
The maximum is 52.1year[2015] of Italy, and the current value is about 96.8%
Services sector, workers aged 15-64 with primary education or less, average age (worldwide)
Between 1981 and 2021, the service sector’s workforce with primary education or less, aged 15-64, has seen a marked aging trend globally. Moldova stands out, reaching the highest recorded average age of 60 years in 2019, a figure it maintains today. This reflects significant demographic and economic challenges, including emigration of younger workers and limited education advancements. Moldova’s reliance on older workers underscores labor market rigidity and a lack of generational renewal. This trend highlights the urgent need for education reforms, upskilling programs, and policies to attract and retain younger workers in the service sector.
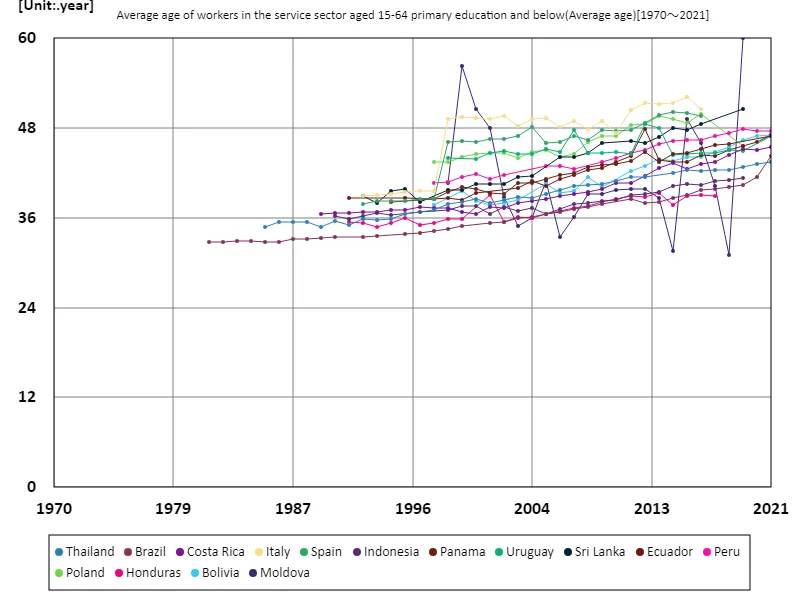
The maximum is the latest one, 60year of Moldova
Services sector, workers aged 15-64 with primary education or less, average age (world countries, latest year)
In 2021, the global service sector workforce aged 15-64 with primary education or less had an average age of 42.9 years, with Peru recording the highest at 47.5 years. The total cumulative age of 558 years highlights the gradual aging of this demographic, driven by declining birth rates and longer working lives. The trend reflects limited education access and slow integration of younger, more educated workers into low-skilled roles. These patterns underscore challenges in workforce renewal and adaptability, calling for targeted efforts in education, reskilling, and policies to foster a more balanced and sustainable labor force.
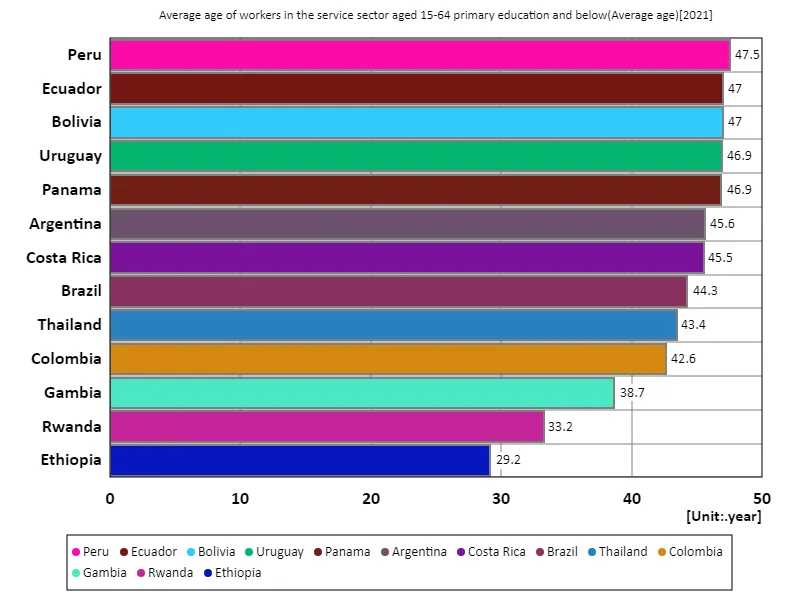
The maximum is 47.5year of Peru, the average is 42.9year, and the total is 558year
Main data
| Average age of workers in the service sector aged 15-64 primary education and below(Average age) [year] | ||||||||||
|---|---|---|---|---|---|---|---|---|---|---|
| Malta | Korea | United Kingdom | Croatia | Denmark | France | Ireland | Italy | Cyprus | Portugal | |
| 2021 | ||||||||||
| 2020 | ||||||||||
| 2019 | ||||||||||
| 2018 | 58.4 | |||||||||
| 2017 | 58.25 | |||||||||
| 2016 | 59.83 | 57.9 | 52.25 | 51.98 | 51.92 | 50.71 | 50.6 | 50.48 | 50.46 | 50.02 |
| 2015 | 59.8 | 57.46 | 40 | 49.77 | 59.96 | 51 | 51.47 | 52.15 | 49.13 | 49.26 |
| 2014 | 59.06 | 57.15 | 43.35 | 49.39 | 58.64 | 51.3 | 50.41 | 51.28 | 50.01 | 48.95 |
| 2013 | 57.65 | 56.79 | 44.71 | 37 | 51.53 | 52.48 | 51.15 | 48.89 | 48.3 | |
| 2012 | 55.96 | 56.46 | 46.53 | 51 | 50.39 | 51.35 | 48.99 | 47.68 | ||
| 2011 | 52.85 | 56.16 | 48.71 | 50 | 49.71 | 50.39 | 48.57 | 47.12 | ||
| 2010 | 53.92 | 55.84 | 52.02 | 47.32 | 47.08 | |||||
| 2009 | 53.3 | 55.03 | 51.6 | 52.29 | 48.96 | 49.56 | 46.24 | |||
| 2008 | 54.76 | 43.95 | 51.43 | 47.88 | 50.38 | 45.89 | ||||
| 2007 | 48.78 | 50.74 | 51.47 | 48.88 | 49.64 | 45.54 | ||||
| 2006 | 54.04 | 39.67 | 50.53 | 51.4 | 48.13 | 49.12 | 44.84 | |||
| 2005 | 53.6 | 42.68 | 50.62 | 50.47 | 49.31 | 49.12 | 44.38 | |||
| 2004 | 53.09 | 44.03 | 49.94 | 50.83 | 49.15 | 43.95 | ||||
| 2003 | 52.83 | 48.3 | ||||||||
| 2002 | 52.3 | 49.6 | ||||||||
| 2001 | 49.2 | |||||||||
| 2000 | 49.27 | |||||||||
| 1999 | 49.43 | |||||||||
| 1998 | 49.18 | |||||||||
| 1997 | 39.6 | |||||||||
| 1996 | 39.51 | |||||||||
| 1995 | 39.39 | |||||||||
| 1994 | 38.88 | 39.2 | ||||||||
| 1993 | 38.67 | 40.63 | 39.05 | |||||||
| 1992 | 38.91 | 40.39 | 38.93 | |||||||
| 1991 | ||||||||||
| 1990 | ||||||||||
| 1989 | ||||||||||
| 1988 | ||||||||||
| 1987 | ||||||||||
| 1986 | ||||||||||
| 1985 | ||||||||||
| 1984 | ||||||||||
| 1983 | ||||||||||
| 1982 | ||||||||||
| 1981 | ||||||||||
| 1980 | ||||||||||
| 1970 | ||||||||||


Comments