
- Abstract
- Employment rate for all 15-64 year olds in the manufacturing sector (percentage of working-age population)
- Employment rate in the manufacturing sector for all 15-64 year olds (percentage of working-age employed population) (worldwide)
- Employment rate in the manufacturing sector for all 15-64 year olds (percentage of working age employed population) (worldwide, latest year)
- Main data
- Reference
Abstract
In recent years, Thailand has consistently seen a high employment rate in the manufacturing sector, with the 2021 figure of 16.3% for the 15-64 age group standing out globally. Historically, Thailand’s economy has relied heavily on manufacturing, particularly in industries like automotive, electronics, and textiles. This trend reflects the country’s strong industrial base, fostered by both local development and foreign investments. The high manufacturing employment rate indicates a significant portion of the workforce is engaged in production, contributing to economic growth and job creation.
Employment rate for all 15-64 year olds in the manufacturing sector (percentage of working-age population)
Slovenia’s manufacturing sector reached its peak employment rate of 34.4% in 2005, reflecting the country’s industrial strength and role as a key manufacturing hub in Europe. Since then, the rate has declined to 78.3% of its peak, indicating a shift in the economy away from manufacturing towards services and technology. This trend aligns with global patterns where many advanced economies have seen a decrease in manufacturing employment due to automation, offshoring, and the growth of the service sector. Despite this, Slovenia remains a competitive manufacturing economy, emphasizing high-value sectors.
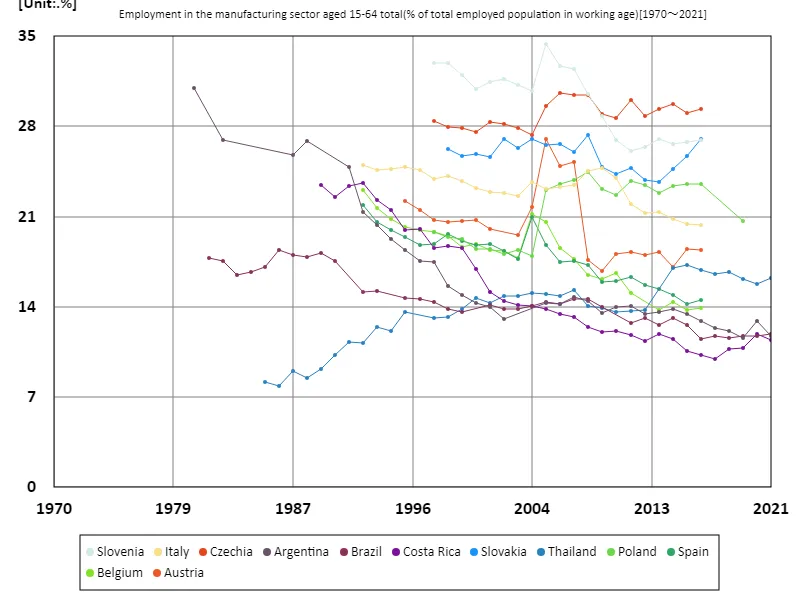
The maximum is 34.4%[2005] of Slovenia, and the current value is about 78.3%
Employment rate in the manufacturing sector for all 15-64 year olds (percentage of working-age employed population) (worldwide)
Slovenia’s manufacturing sector reached its peak employment rate of 34.4% in 2005, highlighting its significant role in the national economy. Since then, the rate has declined to 78.3% of its peak, reflecting broader global trends where advanced economies experience a shift from manufacturing to service-based industries. Factors such as automation, offshoring, and technological advances have contributed to this transition. Despite the decline, Slovenia continues to prioritize high-value manufacturing, maintaining competitiveness in key sectors like automotive and electronics.
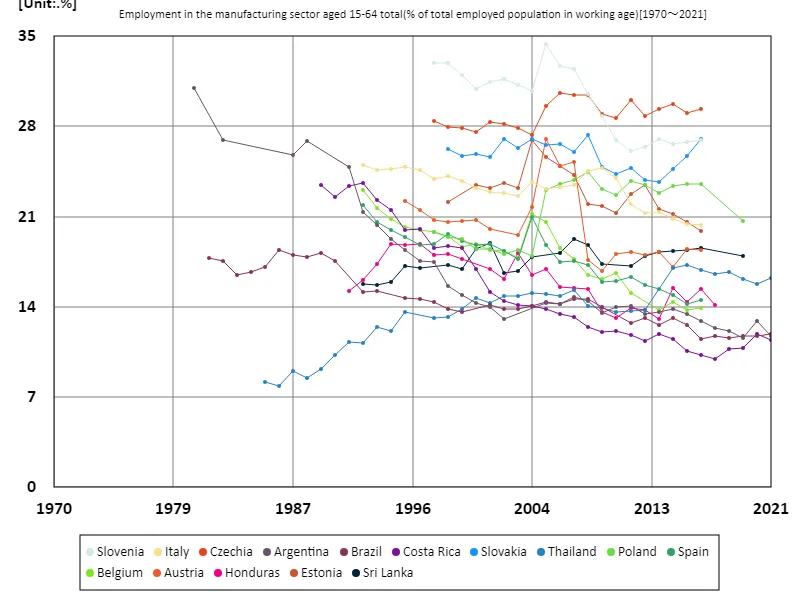
The maximum is 34.4%[2005] of Slovenia, and the current value is about 78.3%
Employment rate in the manufacturing sector for all 15-64 year olds (percentage of working age employed population) (worldwide, latest year)
In 2021, Thailand recorded the highest manufacturing sector employment rate for the 15-64 age group, at 16.3%, well above the global average of 9.49%. This reflects Thailand’s robust industrial base, particularly in automotive, electronics, and textiles. The country’s significant manufacturing workforce highlights its ongoing reliance on production-driven growth. Globally, the trend shows a gradual shift towards service sectors in advanced economies, while manufacturing employment remains a key driver in emerging markets like Thailand, contributing to economic development and job creation.
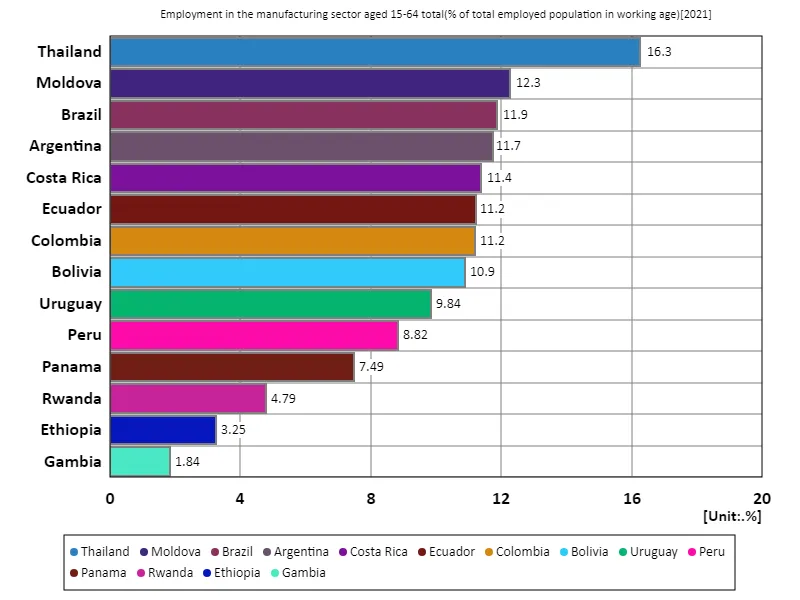
The maximum is 16.3% of Thailand, the average is 9.49%, and the total is 133%
Main data
| Employment in the manufacturing sector aged 15-64 total(% of total employed population in working age, Total, Manufacturing sector) [%] | ||||||||||
|---|---|---|---|---|---|---|---|---|---|---|
| Czechia | Slovakia | Slovenia | Bulgaria | Poland | Hungary | Croatia | Romania | Italy | Estonia | |
| 2021 | ||||||||||
| 2020 | ||||||||||
| 2019 | 20.69 | |||||||||
| 2018 | ||||||||||
| 2017 | ||||||||||
| 2016 | 29.33 | 27.02 | 26.92 | 23.96 | 23.53 | 23.38 | 22.64 | 21.38 | 20.31 | 19.87 |
| 2015 | 29.02 | 25.72 | 26.81 | 24.57 | 23.5 | 22.6 | 21.81 | 21.71 | 20.4 | 20.56 |
| 2014 | 29.73 | 24.65 | 26.64 | 23.57 | 23.39 | 23 | 21.69 | 21.93 | 20.81 | 21.17 |
| 2013 | 29.34 | 23.68 | 26.99 | 23.61 | 22.81 | 23.9 | 23 | 22.29 | 21.34 | 21.57 |
| 2012 | 28.83 | 23.81 | 26.4 | 23.62 | 23.46 | 23.35 | 23.07 | 21.99 | 21.31 | 23.44 |
| 2011 | 30.06 | 24.78 | 26.12 | 23.08 | 23.78 | 22.95 | 22.63 | 22.87 | 21.97 | 22.73 |
| 2010 | 28.65 | 24.28 | 26.93 | 22.62 | 22.7 | 22.58 | 23.06 | 23.99 | 21.3 | |
| 2009 | 28.99 | 24.84 | 28.83 | 23.32 | 23.17 | 22.94 | 23.52 | 24.74 | 21.79 | |
| 2008 | 30.42 | 27.29 | 30.54 | 25.3 | 24.45 | 24.06 | 23.56 | 24.55 | 22 | |
| 2007 | 30.46 | 26.02 | 32.42 | 33.44 | 23.83 | 23.83 | 23.74 | 23.44 | 24.23 | |
| 2006 | 30.6 | 26.61 | 32.69 | 24.16 | 23.54 | 24.62 | 23.33 | 24.91 | ||
| 2005 | 29.6 | 26.57 | 34.37 | 24.67 | 23.04 | 22.29 | 25.04 | 23.17 | 25.61 | |
| 2004 | 27.36 | 26.99 | 30.78 | 24.24 | 17.93 | 22.87 | 26.37 | 23.65 | 26.92 | |
| 2003 | 27.9 | 26.29 | 31.21 | 23.22 | 18.39 | 24.65 | 22.58 | 23.22 | ||
| 2002 | 28.2 | 27.04 | 31.69 | 24.05 | 18.1 | 24.14 | 22.84 | 23.63 | ||
| 2001 | 28.32 | 25.63 | 31.45 | 21.34 | 18.46 | 25.27 | 22.91 | 23.2 | ||
| 2000 | 27.54 | 25.85 | 30.87 | 18.49 | 23.22 | 23.44 | ||||
| 1999 | 27.89 | 25.68 | 31.95 | 19.24 | 23.79 | |||||
| 1998 | 27.96 | 26.26 | 32.89 | 19.44 | 24.13 | 22.12 | ||||
| 1997 | 28.38 | 32.92 | 19.83 | 23.89 | ||||||
| 1996 | 24.61 | |||||||||
| 1995 | 24.85 | |||||||||
| 1994 | 24.68 | |||||||||
| 1993 | 24.61 | |||||||||
| 1992 | 25.03 | |||||||||
| 1991 | ||||||||||
| 1990 | ||||||||||
| 1989 | ||||||||||
| 1988 | ||||||||||
| 1987 | ||||||||||
| 1986 | ||||||||||
| 1985 | ||||||||||
| 1984 | ||||||||||
| 1983 | ||||||||||
| 1982 | ||||||||||
| 1981 | ||||||||||
| 1980 | ||||||||||
| 1970 | ||||||||||


Comments