
Abstract
The UK’s bilateral loans dominance, with $3.71 trillion in 2023.25, reflects its historic role as a global financial hub. This trend aligns with London’s status as a center for cross-border banking and international capital flows. Over the past decades, the UK’s external debt consistently ranked high, driven by its robust banking sector facilitating loans to and from diverse economies. Key characteristics include a strong presence of multinational financial institutions, currency flexibility (USD predominance), and the UK’s role in intermediating funds between advanced and emerging markets, amplifying its global economic influence.
Crossborder deposits with bis rep banks
Bilateral lending in the global economy has shown significant shifts from 1995.75 to 2023.25. The UK’s peak at $5.3 trillion in 2008 reflected its role as a central hub during a period of rapid financial globalization. However, the financial crisis that same year prompted tighter regulations and deleveraging, leading to a steady decline. Currently at 70% of its peak, the UK remains a leader, driven by its strong banking infrastructure and integration in global trade. Trends show increased diversification in lenders, with emerging markets gaining prominence, while advanced economies, like the UK, adapt to changing dynamics and risk aversion in cross-border lending.
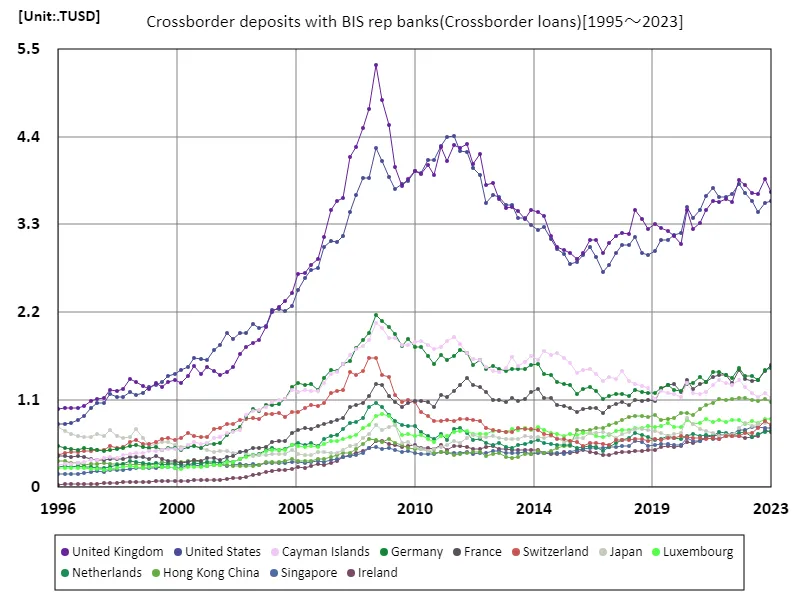
The maximum is 5.3TUSD[2008] of United Kingdom, and the current value is about 70%
Crossborder deposits with bis rep banks (worldwide)
Bilateral lending, as tracked by the Bank for International Settlements, highlights the UK’s pivotal role in global finance. From 1995.75 to 2023.25, lending peaked in 2008 at $5.3 trillion, reflecting pre-crisis financial expansion. The 2008 financial crisis marked a turning point, with regulatory reforms and risk adjustments leading to a 30% decline in the UK’s bilateral lending, now at 70% of its peak. Trends reveal a shift toward diversified lending sources, with emerging markets gaining traction. Meanwhile, the UK continues to leverage its robust banking sector and global financial integration, maintaining a leading role despite reduced volumes.
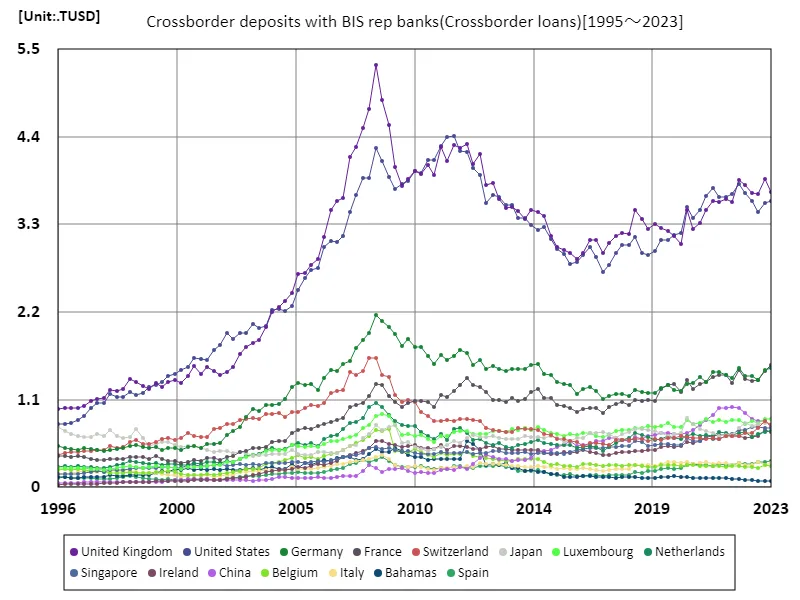
The maximum is 5.3TUSD[2008] of United Kingdom, and the current value is about 70%
Crossborder deposits with bis rep banks (worldwide, latest year)
As of 2023.25, global bilateral lending totals $24 trillion, averaging $110 billion per country, with the UK leading at $3.71 trillion. This reflects the UK’s longstanding position as a global financial hub, supported by its advanced banking sector and role in cross-border transactions. The concentration of lending in major economies underscores their capacity to intermediate global funds, while smaller economies contribute modestly. Trends reveal a post-crisis stabilization, with steady growth in emerging markets and diversification of borrowers and lenders. Despite global challenges, the UK remains central to international lending networks, driving global financial interconnectivity.
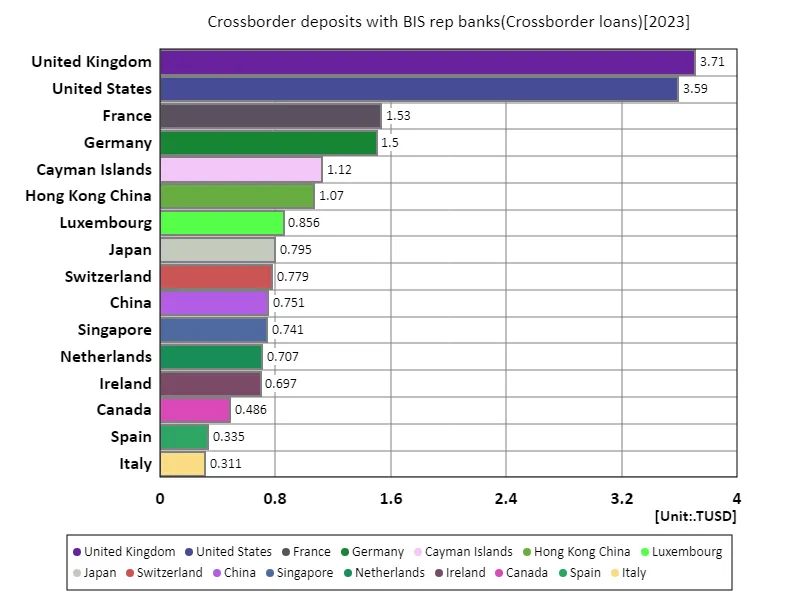
The maximum is 3.71TUSD of United Kingdom, the average is 110GUSD, and the total is 24TUSD
Crossborder deposits with bis rep banks (worldwide, latest year)
As of 2023.25, global bilateral cross-border lending totals $21 trillion, with an average of $107 billion per country. The UK leads with $3.71 trillion, reflecting its dominant role in global finance. This high figure is rooted in London’s strong financial infrastructure and central role in international capital flows. The trends show a shift toward diversification, with emerging markets increasing their share of lending activity. Despite challenges like regulatory changes and market volatility, the UK maintains a significant share, highlighting its continued importance in facilitating global cross-border lending.
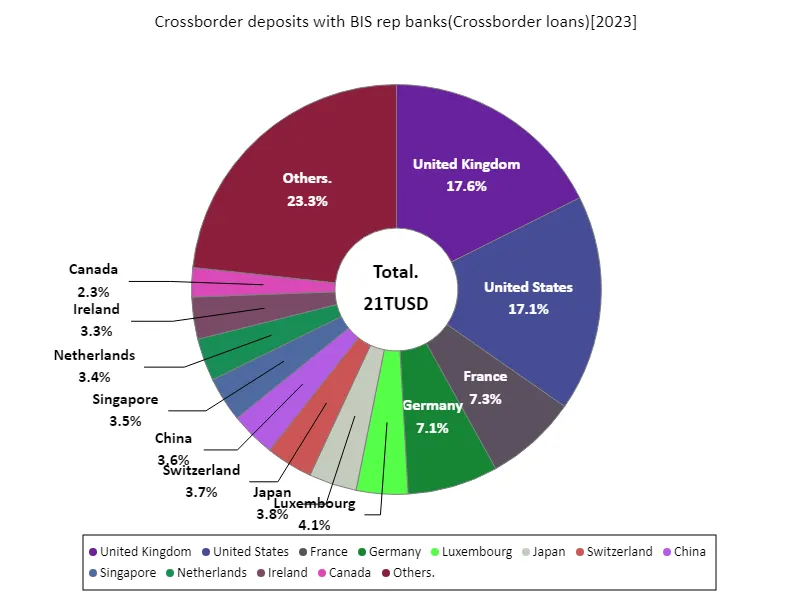
The maximum is 3.71TUSD of United Kingdom, the average is 108GUSD, and the total is 21TUSD
Main data
| Crossborder deposits with BIS rep banks(Crossborder loans) [TUSD] | ||||||||||
|---|---|---|---|---|---|---|---|---|---|---|
| United Kingdom | United States | France | Germany | Cayman Islands | Hong Kong China | Luxembourg | Japan | Switzerland | China | |
| 2023.25 | 3.71 | 3.59 | 1.53 | 1.5 | 1.12 | 1.07 | 0.86 | 0.79 | 0.78 | 0.75 |
| 2023.0 | 3.87 | 3.57 | 1.46 | 1.47 | 1.19 | 1.11 | 0.86 | 0.8 | 0.83 | 0.83 |
| 2022.75 | 3.68 | 3.45 | 1.35 | 1.35 | 1.14 | 1.09 | 0.81 | 0.8 | 0.74 | 0.83 |
| 2022.5 | 3.69 | 3.59 | 1.33 | 1.39 | 1.19 | 1.09 | 0.84 | 0.77 | 0.68 | 0.85 |
| 2022.25 | 3.79 | 3.7 | 1.36 | 1.4 | 1.26 | 1.12 | 0.8 | 0.8 | 0.68 | 0.93 |
| 2022.0 | 3.86 | 3.81 | 1.47 | 1.49 | 1.35 | 1.12 | 0.85 | 0.74 | 0.65 | 1 |
| 2021.75 | 3.58 | 3.68 | 1.3 | 1.37 | 1.28 | 1.11 | 0.84 | 0.66 | 0.64 | 1.01 |
| 2021.5 | 3.62 | 3.64 | 1.41 | 1.4 | 1.31 | 1.1 | 0.82 | 0.66 | 0.64 | 0.99 |
| 2021.25 | 3.58 | 3.64 | 1.4 | 1.45 | 1.35 | 1.11 | 0.85 | 0.64 | 0.61 | 1 |
| 2021.0 | 3.6 | 3.76 | 1.39 | 1.44 | 1.28 | 1.06 | 0.82 | 0.68 | 0.62 | 0.91 |
| 2020.75 | 3.47 | 3.66 | 1.32 | 1.32 | 1.2 | 1.03 | 0.86 | 0.71 | 0.61 | 0.84 |
| 2020.5 | 3.32 | 3.48 | 1.3 | 1.39 | 1.18 | 0.98 | 0.81 | 0.73 | 0.62 | 0.78 |
| 2020.25 | 3.24 | 3.38 | 1.23 | 1.31 | 1.18 | 0.91 | 0.79 | 0.79 | 0.62 | 0.72 |
| 2020.0 | 3.48 | 3.51 | 1.35 | 1.29 | 1.31 | 0.94 | 0.84 | 0.87 | 0.63 | 0.68 |
| 2019.75 | 3.06 | 3.19 | 1.2 | 1.2 | 1.14 | 0.94 | 0.76 | 0.69 | 0.64 | 0.67 |
| 2019.5 | 3.16 | 3.17 | 1.3 | 1.22 | 1.16 | 0.87 | 0.75 | 0.67 | 0.62 | 0.67 |
| 2019.25 | 3.21 | 3.11 | 1.28 | 1.28 | 1.19 | 0.86 | 0.81 | 0.64 | 0.62 | 0.69 |
| 2019.0 | 3.25 | 3.1 | 1.24 | 1.24 | 1.2 | 0.85 | 0.77 | 0.68 | 0.6 | 0.68 |
| 2018.75 | 3.31 | 2.96 | 1.08 | 1.18 | 1.1 | 0.91 | 0.76 | 0.71 | 0.61 | 0.65 |
| 2018.5 | 3.24 | 2.92 | 1.1 | 1.19 | 1.24 | 0.88 | 0.77 | 0.71 | 0.58 | 0.65 |
| 2018.25 | 3.37 | 2.94 | 1.08 | 1.19 | 1.27 | 0.9 | 0.74 | 0.74 | 0.61 | 0.61 |
| 2018.0 | 3.49 | 3.14 | 1.09 | 1.22 | 1.3 | 0.9 | 0.75 | 0.74 | 0.6 | 0.63 |
| 2017.75 | 3.18 | 3.05 | 1.03 | 1.14 | 1.34 | 0.88 | 0.73 | 0.69 | 0.6 | 0.58 |
| 2017.5 | 3.2 | 3.04 | 1.07 | 1.17 | 1.46 | 0.84 | 0.73 | 0.67 | 0.59 | 0.6 |
| 2017.25 | 3.15 | 2.94 | 1.04 | 1.17 | 1.36 | 0.81 | 0.71 | 0.62 | 0.59 | 0.62 |
| 2017.0 | 3.06 | 2.79 | 1.01 | 1.15 | 1.38 | 0.79 | 0.65 | 0.67 | 0.53 | 0.62 |
| 2016.75 | 2.94 | 2.71 | 0.93 | 1.11 | 1.34 | 0.74 | 0.63 | 0.69 | 0.54 | 0.58 |
| 2016.5 | 3.11 | 2.89 | 0.99 | 1.21 | 1.42 | 0.75 | 0.65 | 0.68 | 0.56 | 0.58 |
| 2016.25 | 3.11 | 3.01 | 0.99 | 1.26 | 1.48 | 0.72 | 0.68 | 0.68 | 0.56 | 0.54 |
| 2016.0 | 2.94 | 2.92 | 0.98 | 1.23 | 1.47 | 0.71 | 0.68 | 0.62 | 0.52 | 0.53 |
| 2015.75 | 2.86 | 2.83 | 0.94 | 1.17 | 1.44 | 0.72 | 0.66 | 0.62 | 0.57 | 0.52 |
| 2015.5 | 2.94 | 2.8 | 1 | 1.29 | 1.56 | 0.52 | 0.66 | 0.58 | 0.59 | 0.58 |
| 2015.25 | 2.98 | 2.92 | 1.02 | 1.3 | 1.62 | 0.52 | 0.65 | 0.57 | 0.61 | 0.53 |
| 2015.0 | 3.02 | 3 | 1.03 | 1.32 | 1.69 | 0.49 | 0.68 | 0.62 | 0.6 | 0.51 |
| 2014.75 | 3.16 | 3.12 | 1.12 | 1.41 | 1.66 | 0.45 | 0.68 | 0.65 | 0.66 | 0.47 |
| 2014.5 | 3.4 | 3.27 | 1.12 | 1.43 | 1.71 | 0.43 | 0.72 | 0.62 | 0.67 | 0.46 |
| 2014.25 | 3.45 | 3.23 | 1.23 | 1.55 | 1.59 | 0.45 | 0.76 | 0.64 | 0.72 | 0.46 |
| 2014.0 | 3.48 | 3.29 | 1.2 | 1.54 | 1.65 | 0.41 | 0.72 | 0.63 | 0.73 | 0.37 |
| 2013.75 | 3.37 | 3.37 | 1.1 | 1.49 | 1.57 | 0.42 | 0.75 | 0.64 | 0.74 | 0.35 |
| 2013.5 | 3.47 | 3.38 | 1.09 | 1.48 | 1.52 | 0.39 | 0.72 | 0.6 | 0.75 | 0.34 |
| 2013.25 | 3.52 | 3.54 | 1.12 | 1.48 | 1.64 | 0.37 | 0.73 | 0.6 | 0.69 | 0.33 |
| 2013.0 | 3.5 | 3.55 | 1.07 | 1.46 | 1.49 | 0.38 | 0.69 | 0.61 | 0.7 | 0.35 |
| 2012.75 | 3.62 | 3.65 | 1.09 | 1.48 | 1.44 | 0.43 | 0.7 | 0.62 | 0.7 | 0.35 |
| 2012.5 | 3.82 | 3.67 | 1.09 | 1.52 | 1.46 | 0.42 | 0.71 | 0.65 | 0.72 | 0.38 |
| 2012.25 | 3.79 | 3.57 | 1.19 | 1.49 | 1.5 | 0.4 | 0.67 | 0.63 | 0.75 | 0.4 |
| 2012.0 | 4.18 | 3.92 | 1.26 | 1.59 | 1.6 | 0.45 | 0.67 | 0.63 | 0.83 | 0.37 |
| 2011.75 | 4.06 | 4.01 | 1.29 | 1.54 | 1.62 | 0.45 | 0.67 | 0.66 | 0.84 | 0.29 |
| 2011.5 | 4.31 | 4.21 | 1.38 | 1.69 | 1.68 | 0.43 | 0.7 | 0.62 | 0.85 | 0.23 |
| 2011.25 | 4.26 | 4.22 | 1.28 | 1.72 | 1.8 | 0.41 | 0.7 | 0.56 | 0.85 | 0.25 |
| 2011.0 | 4.3 | 4.41 | 1.2 | 1.65 | 1.89 | 0.41 | 0.69 | 0.58 | 0.83 | 0.22 |
| 2010.75 | 4.1 | 4.39 | 1.13 | 1.6 | 1.83 | 0.44 | 0.64 | 0.53 | 0.85 | 0.24 |
| 2010.5 | 4.28 | 4.28 | 1.16 | 1.66 | 1.76 | 0.44 | 0.64 | 0.5 | 0.84 | 0.22 |
| 2010.25 | 3.92 | 4.11 | 1 | 1.55 | 1.73 | 0.43 | 0.56 | 0.48 | 0.83 | 0.18 |
| 2010.0 | 4.05 | 4.11 | 1.07 | 1.65 | 1.79 | 0.46 | 0.6 | 0.46 | 0.89 | 0.18 |
| 2009.75 | 3.93 | 3.95 | 1.08 | 1.76 | 1.84 | 0.48 | 0.66 | 0.48 | 0.94 | 0.19 |
| 2009.5 | 3.97 | 3.97 | 1.08 | 1.76 | 1.83 | 0.48 | 0.65 | 0.51 | 1.07 | 0.18 |
| 2009.25 | 3.88 | 3.85 | 1.06 | 1.86 | 1.79 | 0.49 | 0.67 | 0.56 | 1.1 | 0.2 |
| 2009.0 | 3.78 | 3.8 | 1.01 | 1.77 | 1.79 | 0.53 | 0.65 | 0.56 | 1.07 | 0.24 |
| 2008.75 | 4.02 | 3.75 | 1.07 | 1.92 | 1.87 | 0.55 | 0.78 | 0.78 | 1.16 | 0.23 |
| 2008.5 | 4.55 | 3.9 | 1.14 | 2.01 | 1.87 | 0.6 | 0.89 | 0.75 | 1.38 | 0.24 |
| 2008.25 | 4.86 | 4.1 | 1.29 | 2.09 | 2 | 0.56 | 0.92 | 0.72 | 1.41 | 0.19 |
| 2008.0 | 5.3 | 4.26 | 1.3 | 2.16 | 2.06 | 0.59 | 0.9 | 0.78 | 1.62 | 0.25 |
| 2007.75 | 4.75 | 3.88 | 1.14 | 1.94 | 1.85 | 0.6 | 0.79 | 0.67 | 1.62 | 0.28 |
| 2007.5 | 4.51 | 3.89 | 1.06 | 1.85 | 1.78 | 0.55 | 0.74 | 0.62 | 1.46 | 0.2 |
| 2007.25 | 4.27 | 3.67 | 1.03 | 1.75 | 1.73 | 0.47 | 0.66 | 0.53 | 1.41 | 0.14 |
| 2007.0 | 4.14 | 3.45 | 1.01 | 1.58 | 1.66 | 0.43 | 0.63 | 0.51 | 1.45 | 0.14 |
| 2006.75 | 3.63 | 3.16 | 0.87 | 1.54 | 1.55 | 0.43 | 0.6 | 0.46 | 1.22 | 0.15 |
| 2006.5 | 3.59 | 3.08 | 0.84 | 1.46 | 1.44 | 0.4 | 0.58 | 0.43 | 1.21 | 0.13 |
| 2006.25 | 3.49 | 3.09 | 0.82 | 1.48 | 1.42 | 0.38 | 0.58 | 0.44 | 1.18 | 0.12 |
| 2006.0 | 3.14 | 3.01 | 0.8 | 1.37 | 1.3 | 0.36 | 0.54 | 0.44 | 1.06 | 0.12 |
| 2005.75 | 2.86 | 2.75 | 0.77 | 1.23 | 1.21 | 0.35 | 0.51 | 0.44 | 1.02 | 0.13 |
| 2005.5 | 2.8 | 2.73 | 0.73 | 1.3 | 1.2 | 0.33 | 0.52 | 0.4 | 1.04 | 0.12 |
| 2005.25 | 2.69 | 2.62 | 0.75 | 1.28 | 1.23 | 0.33 | 0.5 | 0.41 | 1 | 0.12 |
| 2005.0 | 2.68 | 2.48 | 0.72 | 1.3 | 1.19 | 0.33 | 0.52 | 0.42 | 0.94 | 0.11 |
| 2004.75 | 2.44 | 2.28 | 0.69 | 1.26 | 1.22 | 0.35 | 0.54 | 0.47 | 0.94 | 0.11 |
| 2004.5 | 2.34 | 2.22 | 0.59 | 1.11 | 1.1 | 0.33 | 0.47 | 0.42 | 0.88 | 0.13 |
| 2004.25 | 2.26 | 2.23 | 0.59 | 1.05 | 1.09 | 0.32 | 0.46 | 0.42 | 0.93 | 0.13 |
| 2004.0 | 2.21 | 2.23 | 0.57 | 1.03 | 1.07 | 0.32 | 0.47 | 0.42 | 0.92 | 0.11 |
| 2003.75 | 2.01 | 2.03 | 0.51 | 1.03 | 1.01 | 0.31 | 0.45 | 0.41 | 0.92 | 0.09 |
| 2003.5 | 1.85 | 2 | 0.5 | 0.96 | 0.97 | 0.28 | 0.41 | 0.41 | 0.86 | 0.09 |
| 2003.25 | 1.81 | 2.05 | 0.49 | 0.98 | 0.95 | 0.27 | 0.41 | 0.39 | 0.88 | 0.08 |
| 2003.0 | 1.76 | 1.94 | 0.45 | 0.88 | 0.91 | 0.26 | 0.38 | 0.43 | 0.86 | 0.09 |
| 2002.75 | 1.68 | 1.94 | 0.44 | 0.76 | 0.72 | 0.27 | 0.35 | 0.44 | 0.85 | 0.09 |
| 2002.5 | 1.51 | 1.86 | 0.39 | 0.71 | 0.69 | 0.27 | 0.32 | 0.43 | 0.79 | 0.09 |
| 2002.25 | 1.45 | 1.94 | 0.38 | 0.66 | 0.68 | 0.28 | 0.31 | 0.46 | 0.8 | 0.09 |
| 2002.0 | 1.41 | 1.78 | 0.34 | 0.55 | 0.63 | 0.28 | 0.27 | 0.46 | 0.74 | 0.09 |
| 2001.75 | 1.46 | 1.72 | 0.37 | 0.55 | 0.62 | 0.3 | 0.28 | 0.45 | 0.73 | 0.09 |
| 2001.5 | 1.5 | 1.6 | 0.36 | 0.54 | 0.56 | 0.3 | 0.26 | 0.47 | 0.63 | 0.1 |
| 2001.25 | 1.42 | 1.61 | 0.34 | 0.5 | 0.55 | 0.32 | 0.25 | 0.5 | 0.63 | 0.1 |
| 2001.0 | 1.52 | 1.62 | 0.34 | 0.51 | 0.57 | 0.33 | 0.26 | 0.52 | 0.64 | 0.1 |
| 2000.75 | 1.39 | 1.51 | 0.32 | 0.5 | 0.53 | 0.33 | 0.25 | 0.52 | 0.68 | 0.1 |
| 2000.5 | 1.31 | 1.47 | 0.31 | 0.47 | 0.49 | 0.31 | 0.23 | 0.51 | 0.62 | 0.09 |
| 2000.25 | 1.35 | 1.42 | 0.33 | 0.49 | 0.48 | 0.3 | 0.25 | 0.53 | 0.6 | 0.09 |
| 2000.0 | 1.32 | 1.4 | 0.33 | 0.49 | 0.48 | 0.31 | 0.25 | 0.57 | 0.62 | 0.08 |
| 1999.75 | 1.26 | 1.32 | 0.36 | 0.47 | 0.47 | 0.32 | 0.26 | 0.57 | 0.6 | 0.07 |
| 1999.5 | 1.31 | 1.28 | 0.39 | 0.5 | 0.46 | 0.29 | 0.27 | 0.54 | 0.57 | 0.07 |
| 1999.25 | 1.23 | 1.26 | 0.36 | 0.49 | 0.46 | 0.28 | 0.26 | 0.52 | 0.54 | 0.06 |
| 1999.0 | 1.27 | 1.19 | 0.38 | 0.5 | 0.43 | 0.28 | 0.24 | 0.62 | 0.54 | 0.06 |
| 1998.75 | 1.32 | 1.16 | 0.38 | 0.53 | 0.43 | 0.29 | 0.25 | 0.73 | 0.59 | 0.07 |
| 1998.5 | 1.37 | 1.19 | 0.38 | 0.52 | 0.42 | 0.28 | 0.26 | 0.63 | 0.56 | 0.07 |
| 1998.25 | 1.23 | 1.14 | 0.35 | 0.5 | 0.41 | 0.29 | 0.26 | 0.62 | 0.51 | 0.07 |
| 1998.0 | 1.21 | 1.13 | 0.36 | 0.47 | 0.37 | 0.29 | 0.24 | 0.65 | 0.49 | 0.07 |
| 1997.75 | 1.22 | 1.17 | 0.36 | 0.46 | 0.38 | 0.3 | 0.23 | 0.73 | 0.52 | 0.06 |
| 1997.5 | 1.13 | 1.06 | 0.34 | 0.45 | 0.37 | 0.3 | 0.22 | 0.64 | 0.47 | 0.06 |
| 1997.25 | 1.11 | 1.06 | 0.35 | 0.47 | 0.35 | 0.3 | 0.23 | 0.67 | 0.46 | 0.06 |
| 1997.0 | 1.08 | 0.99 | 0.35 | 0.47 | 0.34 | 0.3 | 0.23 | 0.63 | 0.46 | 0.06 |
| 1996.75 | 1.02 | 0.9 | 0.37 | 0.49 | 0.32 | 0.28 | 0.24 | 0.63 | 0.45 | 0.07 |
| 1996.5 | 0.99 | 0.84 | 0.39 | 0.47 | 0.3 | 0.3 | 0.24 | 0.64 | 0.44 | 0.06 |
| 1996.25 | 0.99 | 0.81 | 0.38 | 0.48 | 0.3 | 0.3 | 0.24 | 0.66 | 0.44 | 0.06 |
| 1996.0 | 1 | 0.8 | 0.39 | 0.5 | 0.29 | 0.32 | 0.25 | 0.71 | 0.43 | 0.05 |
| 1995.75 | 0.98 | 0.79 | 0.4 | 0.51 | 0.28 | 0.33 | 0.25 | 0.76 | 0.41 | 0.06 |


Comments