
Abstract
In recent years, global imports of goods and services have seen steady growth, reflecting expanding trade and economic integration. In 2023, the highest recorded value of 30.2 trillion USD highlighted a recovery from the pandemic-driven decline in 2020. Key trends include rising demand for high-tech goods, energy resources, and consumer products, driven by economic recovery, urbanization, and supply chain adjustments. Import growth has been especially notable in emerging economies, while shifts in trade policies and global tensions have influenced patterns in trade flows.
Imports of goods and services (usd)
From 1960 to 2023, global imports of goods and services have steadily increased, peaking at 30.8 trillion USD in 2022. This rise reflects significant economic globalization, technological advancements, and growing consumer demand. The 98.3% of peak imports in 2023 suggest that trade volumes have nearly recovered to their highest levels, despite challenges such as the pandemic and geopolitical tensions. Key trends include a surge in high-value imports like electronics and energy, while supply chain disruptions and shifts in trade policies have reshaped global trade dynamics.
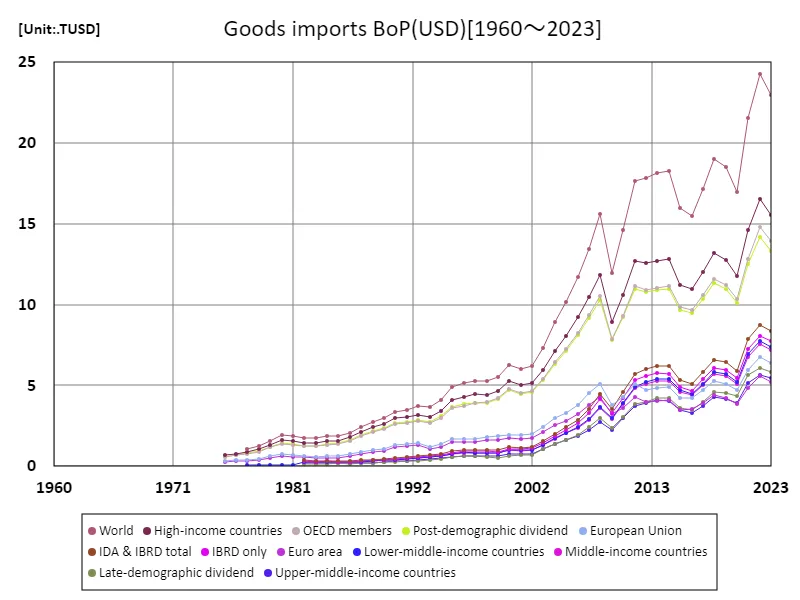
The maximum is 24.3TUSD[2022] of World, and the current value is about 94.5%
Imports of goods and services (usd) (worldwide)
From 1960 to 2023, U.S. imports of goods and services have experienced consistent growth, reaching a peak of 3.97 trillion USD in 2022, reflecting the nation’s deep integration into global trade. The U.S. continues to be a major importer, driven by strong demand for consumer goods, electronics, and energy. Trends highlight the shift towards high-tech imports and a reliance on global supply chains. Despite challenges like trade tensions and disruptions, the U.S. has maintained robust import levels, with 2023 maintaining its peak, underscoring economic recovery and consumer resilience.
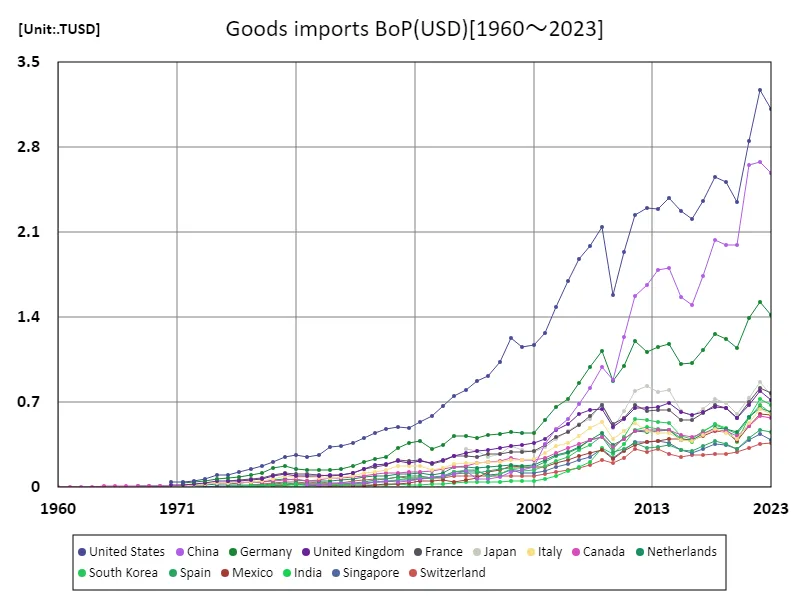
The maximum is 3.27TUSD[2022] of United States, and the current value is about 95.1%
Imports of goods and services (usd) (World Country, latest year)
As of 2023, China leads global imports with 3.13 trillion USD, marking its dominance in world trade. This reflects China’s position as both a manufacturing hub and a key consumer market, with imports spanning raw materials, high-tech components, and consumer goods. The average import value per country stands at 167 billion USD, contributing to a total of 22.6 trillion USD globally. Key trends include China’s increasing demand for technology and energy resources, and the broader shift toward more diversified supply chains as geopolitical tensions influence global trade flows.
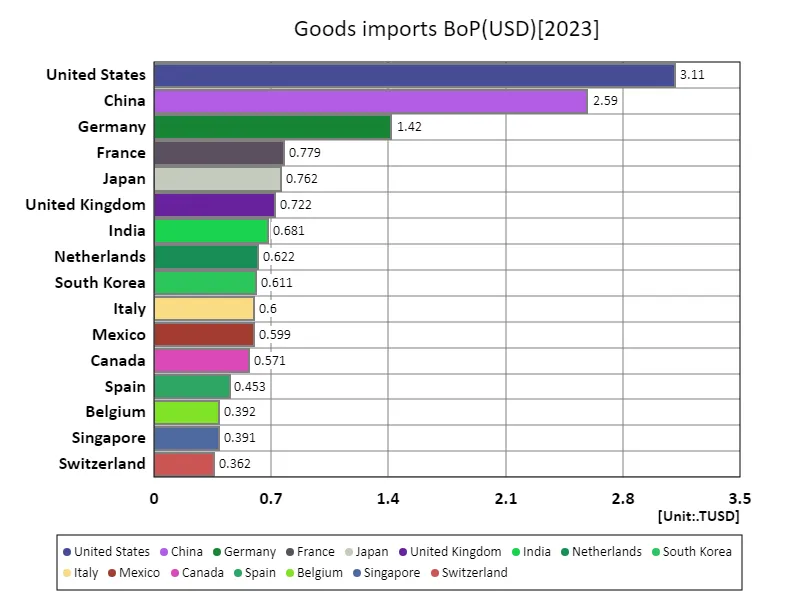
The maximum is 3.11TUSD of United States, the average is 183GUSD, and the total is 20.9TUSD
Imports of goods and services (usd) (region, latest year)
In 2023, the European Union recorded the highest global imports at 8.98 trillion USD, reflecting its central role in global trade. The EU’s diverse economy drives high demand for goods such as machinery, electronics, and energy. With an average import value of 2.58 trillion USD per member, the EU accounts for a substantial share of global imports, contributing to a total of 28.4 trillion USD worldwide. Key trends include the EU’s reliance on global supply chains, increasing imports of green technologies, and a shift towards more resilient trade practices in response to geopolitical tensions and economic uncertainty.
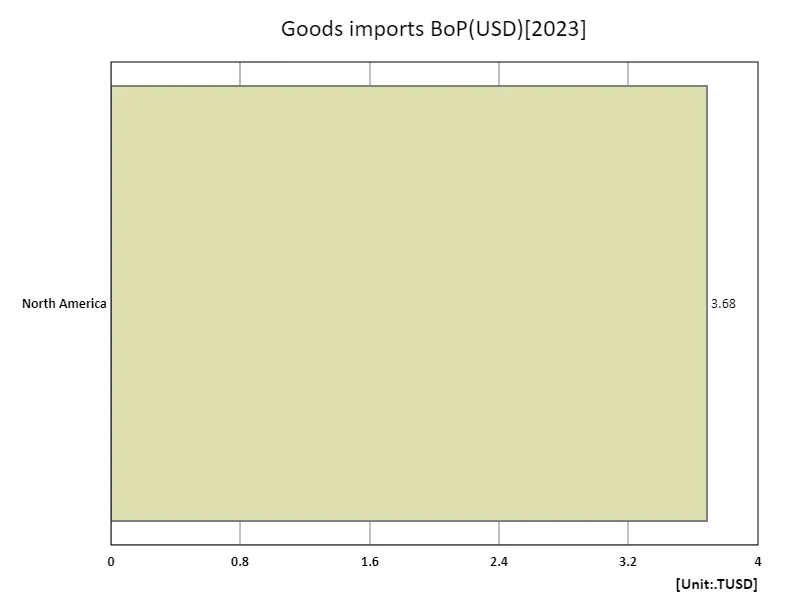
The maximum is 3.68TUSD of North America, the average is 3.68TUSD, and the total is 3.68TUSD


Comments