
Abstract
There are several social and economic factors that may be behind the Virgin Islands’ high female population ratio of 54.5% of the total population in 2050. Looking back at historical data, labour markets and migration patterns are affecting gender ratios in many small island countries and territories. In these regions, tourism is a major industry, and women often play a key role in the workforce. Also, differences in economic opportunities and living conditions between men and women can lead to a relative preponderance of one gender. The Virgin Islands 2050 data is an extension of these trends, reflecting increased female participation in the workforce and demographic changes in certain regions. A detailed analysis of these trends will help us better understand future policy decisions and changes in social structures.
Female population (percentage of total population)
The reason why Latvia recorded a female population ratio of 55.9% of the total population in 1960 was due to changes in social structure during the post-war reconstruction period. During this period in Europe after World War II, many men died in the war, and as a result of the war, the female population ratio tended to be relatively higher. Latvia’s high female population ratio is no exception and is a reflection of the war and the social changes that followed. However, over time, changes in birth, mortality and migration patterns in many countries, including Latvia, led to a gradual decline in the female population ratio. In Latvia, the female population ratio today remains at 93.2% of its peak, which may be due to factors such as declining birth rates and male emigration. In particular, economic development, changes in living conditions, and social factors have a significant impact on the gender ratio. Overall, female population ratios have varied widely across regions and over time, with wars, economic changes, and social policies being major contributing factors. In order to understand future trends, it is necessary to take these factors into account and conduct analysis tailored to the characteristics of each region.
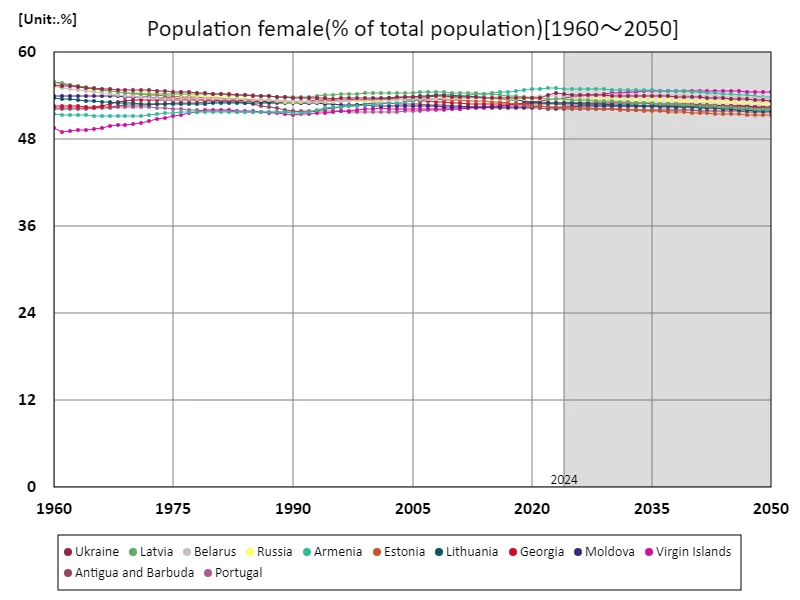
The maximum is 55.9%[1960] of Latvia, and the current value is about 93.2%
Female population (percentage of total population) (worldwide)
The female population ratio of 55.9% in Latvia in 1960 reflects the social changes that took place after the war. At that time, the war caused a high male mortality rate and an increase in the female mortality rate. This trend was not only seen in Latvia, but also in other countries affected by the war. Over time, the female population ratio has gradually stabilized as a result of declining fertility rates, socio-economic changes and shifting migration patterns. The female-to-population ratio in modern Latvia remains at 93.2% of its peak due to factors such as declining birth rates and male emigration. In particular, economic opportunities and changes in social systems have had an impact on the gender ratio, with the improvement in women’s social status also contributing to this. Overall, the female population ratio has fluctuated significantly due to historical background and social changes, and has been influenced by each country’s economy and policies. Understanding these trends can provide insights that can aid in future predictions and policy formulation.
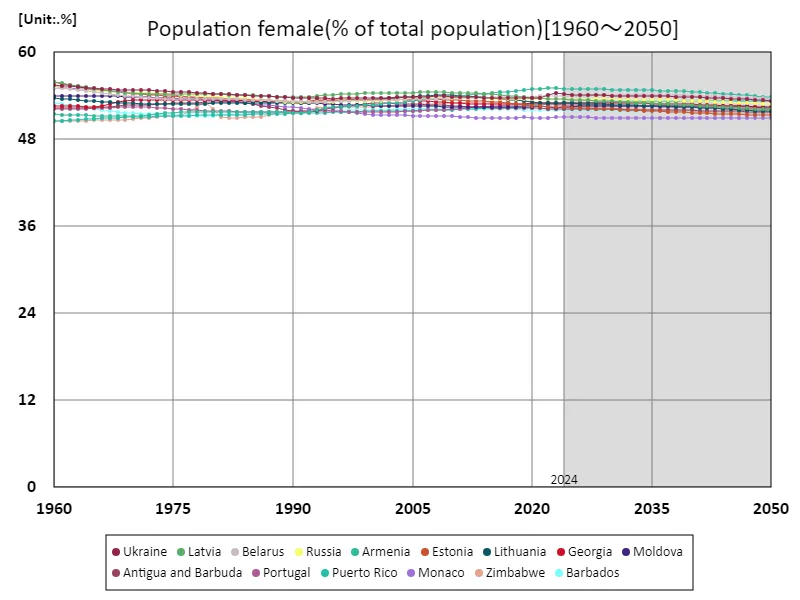
The maximum is 55.9%[1960] of Latvia, and the current value is about 93.2%
Female population (percentage of total population) (Worldwide, latest year)
According to data for 2050, Macau will have a high female population ratio of 55%. This is partly because Macau is particularly dependent on its tourism and entertainment industries, where female labour plays a key role. In tourism-based areas like Macau, there tends to be a higher female workforce. On the other hand, while the global average female population ratio is 50.2%, the total figure of 9.89k% requires caution in interpreting the total figure. Typically, if the total percentage exceeds 100%, there may be some unusual factors involved in the calculation method. This may be due to multiple regions and samples being counted multiple times. A trend over the past few decades has been that of more women entering the workforce, with the proportion of women in the population increasing, especially in urban areas and economically developing regions. This is due to the spread of education, changes in the labour market, and policies promoting gender equality. Looking ahead, it will be interesting to see how further socio-economic changes will affect the female population ratio in each region.
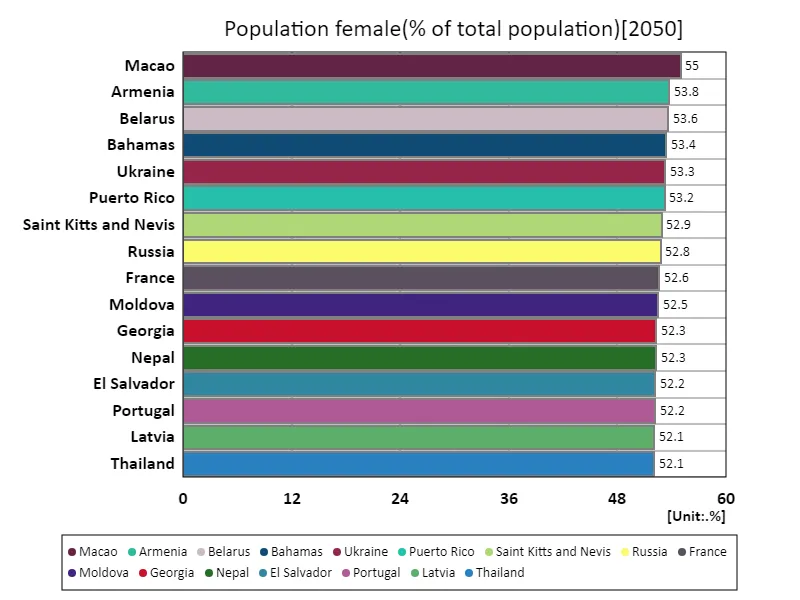
The maximum is 55% of Macao, the average is 50.2%, and the total is 9.79k%
Female population (percentage of total population) (region, latest year)
Data for 2050 shows that Europe and Central Asia will have a high female population ratio of 51.5%. This is due in part to the region’s high standard of living and developed health systems, which in turn are driven by longer female life expectancies and a relatively higher female population ratio. Also contributing are declining birth rates and immigration patterns. This is also due to the fact that these regions are seeing an increase in women’s participation in society and greater equality in education and the workplace. The overall average female population ratio of 50.4% indicates a nearly equal ratio of men and women. This reflects a balanced gender ratio in most countries, although some regional variations may be observed. Please be careful with the number ”total 756%.” This figure may be influenced by differences in data aggregation methods and coverage. Typically the total will not exceed 100%, but interpretation may vary if ”total” refers to the combination of data from multiple samples or regions. Overall, female population ratios vary across regions and over time, and are influenced by a complex mix of factors including health care, education, social policy and immigration.
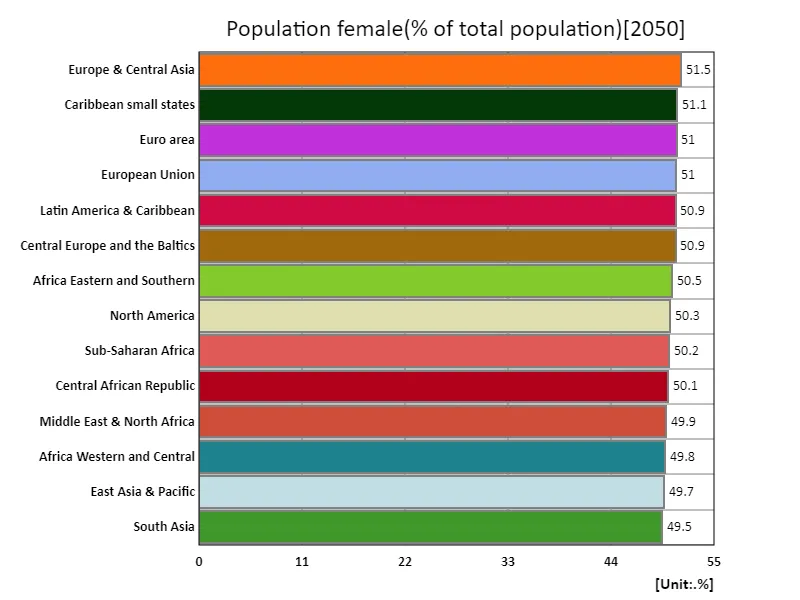
The maximum is 51.5% of Europe & Central Asia, the average is 50.4%, and the total is 756%


Comments