
- Abstract
- Employment rate of women aged 15-64 in clerical occupations (percentage of working-age female employed population)
- Employment rate of women aged 15-64 in clerical occupations (percentage of working-age female employment population) (worldwide)
- Employment rate of clerical workers for women aged 15-64 (percentage of working-age female employed population) (Worldwide, latest year)
- Reference
Abstract
Historically, the employment rate of women in clerical positions has varied significantly across countries. In many developing regions, including South Africa, a notable increase in female participation in clerical work has been observed, reflecting economic shifts and expanded access to education and employment opportunities. By 2020, South Africa had the highest rate at 17.2%, signaling progress in women’s integration into the workforce, though this rate still lags behind global averages. Factors such as economic development, educational advancements, and gender equality policies have influenced these trends.
Employment rate of women aged 15-64 in clerical occupations (percentage of working-age female employed population)
From 1970 to 2020, the employment rate of women aged 15-64 in clerical jobs has seen significant changes globally. The U.S. recorded its peak of 35.8% in 1970, reflecting a period of growing opportunities for women in administrative and office roles. Over the decades, this rate has fluctuated, currently standing at 48.9% of its peak. Factors such as technological advancements, shifts toward service economies, and gender equality policies have influenced these trends. While clerical jobs remain a key area of female employment, the rise of automation and evolving job markets may shape future dynamics.
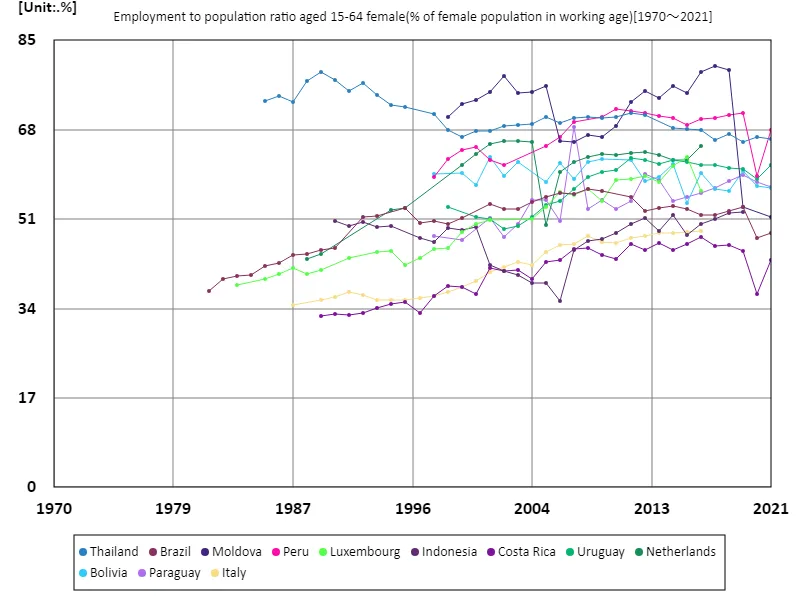
The maximum is 80.2%[2017] of Moldova, and the current value is about 64%
Employment rate of women aged 15-64 in clerical occupations (percentage of working-age female employment population) (worldwide)
From 1970 to 2020, the global employment rate of women aged 15-64 in clerical positions has evolved significantly. The United States reached its peak rate of 35.8% in 1970, driven by the rise of office-based jobs and increased female workforce participation. Today, the U.S. stands at 48.9% of that peak, reflecting shifts due to technological advancements, changes in the service economy, and greater gender equality. While clerical roles remain a significant part of women’s employment, automation and evolving job markets have shaped a decline in these positions over time.
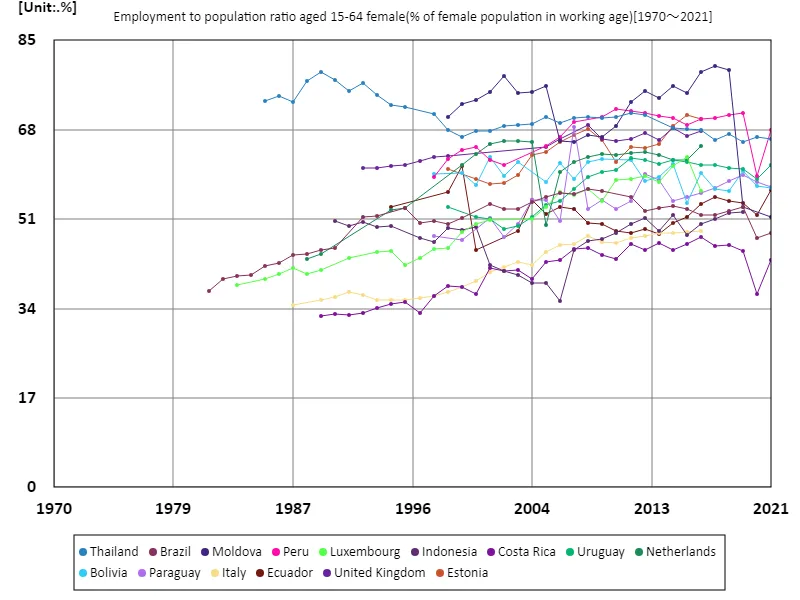
The maximum is 80.2%[2017] of Moldova, and the current value is about 64%
Employment rate of clerical workers for women aged 15-64 (percentage of working-age female employed population) (Worldwide, latest year)
As of 2021, Colombia leads with the highest employment rate of women aged 15-64 in clerical positions at 10.9%, compared to a global average of 4.94%. This reflects the country’s significant integration of women into office-based roles. The total global rate stands at 29.6%, showing a steady but varied trend across regions. Factors like educational access, economic structure, and gender equality policies influence these trends. While clerical jobs remain a vital sector for women, automation and the evolving labor market may impact future employment patterns in these roles globally.
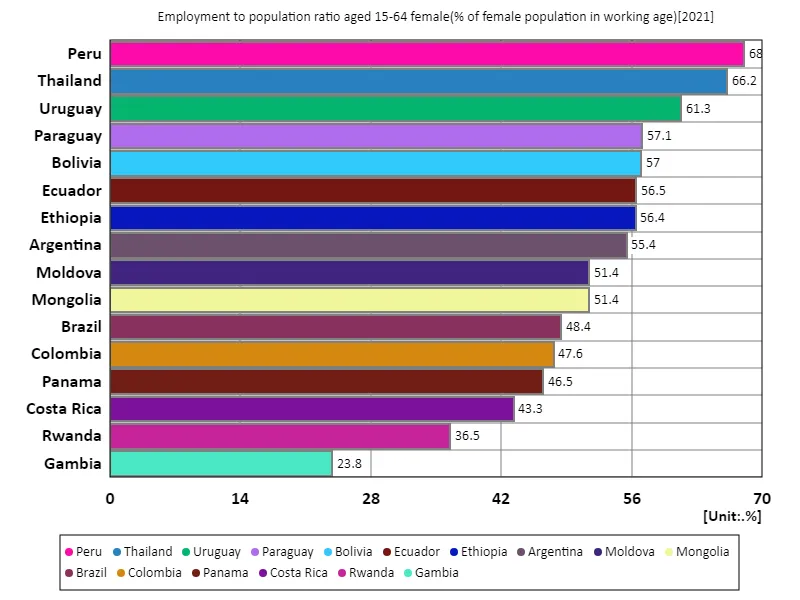
The maximum is 68.1% of Peru, the average is 51.7%, and the total is 827%


Comments