
- Abstract
- Average monthly income (secondary education or above, 15-64 years old, 2010 purchasing power parity)
- Average monthly income (secondary education or above, 15-64 years old, 2010 purchasing power parity) (worldwide)
- Average monthly income (secondary education or above, 15-64 years old, 2010 purchasing power parity) (nations around the world, latest year)
- Main data
- Reference
Abstract
Over the past few decades, global wage trends have been shaped by factors such as economic growth, educational attainment, and inflation. In many developing countries, like South Africa, rising education levels have contributed to higher wages, though they still lag behind those in more advanced economies. South Africa’s relatively high average monthly income of 802 USD (2020, PPP-adjusted) reflects its expanding middle class and increased investment in education. However, disparities remain, with wages in many other African nations and parts of Asia being considerably lower. Economic inequality is a persistent challenge worldwide.
Average monthly income (secondary education or above, 15-64 years old, 2010 purchasing power parity)
Turkey’s peak average monthly income of 762 USD (PPP-adjusted) in 2004 highlights its rapid economic growth during the early 2000s, driven by industrialization and reforms. However, the current level of 130% of its peak reflects significant economic challenges, including inflation and currency depreciation. Over the years, Turkey’s wage growth has been inconsistent, with rising costs and political instability affecting real income levels. Despite this, education and urbanization have played key roles in increasing wages, though disparities remain across regions and sectors. Economic stability and structural reforms remain crucial for future wage growth.

The maximum is 762MUSD[2004] of Turkey, and the current value is about 130μ%
Average monthly income (secondary education or above, 15-64 years old, 2010 purchasing power parity) (worldwide)
Turkey’s highest average monthly income of 762 USD (PPP-adjusted) in 2004 marked a period of robust economic growth driven by reforms and industrialization. However, the current income level at 130% of its peak suggests a notable decline in real income, influenced by factors like inflation, currency depreciation, and economic instability. While education and urbanization have contributed to wage increases, the country’s economic challenges have limited long-term income growth. Structural reforms, addressing inflation, and improving economic stability will be essential for future wage growth in Turkey.
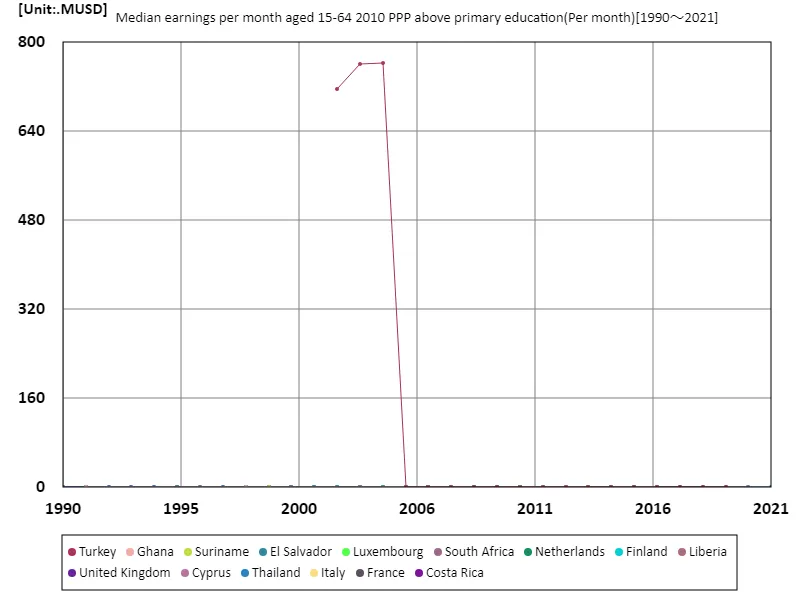
The maximum is 762MUSD[2004] of Turkey, and the current value is about 130μ%
Average monthly income (secondary education or above, 15-64 years old, 2010 purchasing power parity) (nations around the world, latest year)
In 2021, Thailand’s average monthly income for those with secondary education or above (15-64 years old) reached 1,070 USD (PPP-adjusted), significantly above the global average of 513 USD. However, it remains well below the highest total income of 2,050 USD, reflecting disparities between high-income countries and emerging economies. Thailand’s wage growth has been driven by industrialization, urbanization, and improving education levels. Yet, challenges like inflation, income inequality, and economic volatility persist. Future growth will depend on addressing these issues and diversifying the economy.
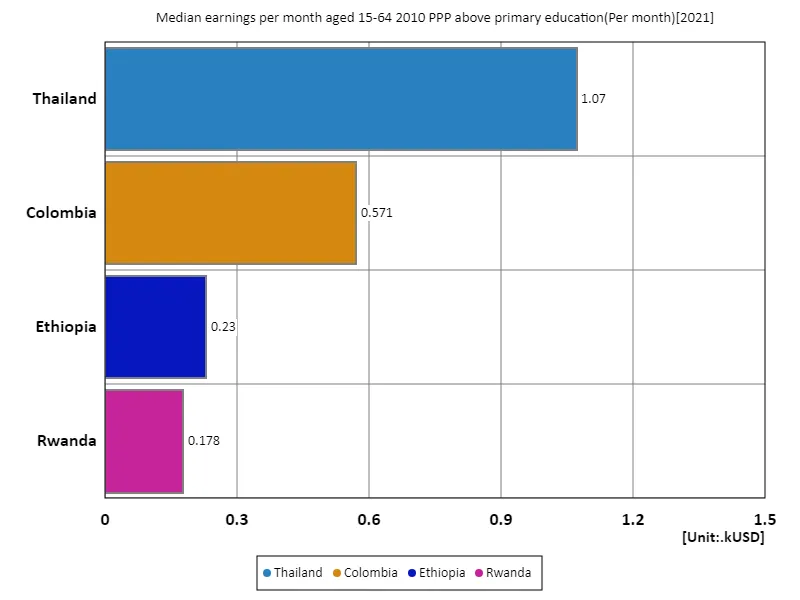
The maximum is 1.07kUSD of Thailand, the average is 513USD, and the total is 2.05kUSD
Main data
| Median earnings per month aged 15-64 2010 PPP above primary education(Per month) [kUSD] | ||||||||||
|---|---|---|---|---|---|---|---|---|---|---|
| Liberia | Cyprus | Netherlands | United Kingdom | Finland | Luxembourg | Malta | France | Ireland | Korea | |
| 2021 | ||||||||||
| 2020 | ||||||||||
| 2019 | ||||||||||
| 2018 | 2.12 | |||||||||
| 2017 | 2.06 | |||||||||
| 2016 | 10.16 | 3.33 | 3.14 | 2.98 | 2.94 | 2.89 | 2.33 | 2.23 | 2.19 | 2.08 |
| 2015 | 3.76 | 3.09 | 2.94 | 2.92 | 3.3 | 2.36 | 2.17 | 2.18 | 2.09 | |
| 2014 | 14.36 | 2.46 | 3.1 | 2.98 | 2.87 | 3.45 | 2.28 | 2.16 | 2.01 | 2.12 |
| 2013 | 2.63 | 3.08 | 2.53 | 2.73 | 3.21 | 2.13 | 1.88 | 1.88 | 2.06 | |
| 2012 | 2.52 | 3.15 | 2.73 | 2.69 | 3.22 | 2.07 | 1.85 | 1.54 | ||
| 2011 | 2.79 | 3.12 | 2.49 | 2.66 | 3.22 | 2.08 | 1.85 | 1.48 | ||
| 2010 | 9.07 | 3.2 | 1.98 | 2.65 | 3.35 | 2.08 | 1.84 | 1.47 | ||
| 2009 | 2.21 | 3.16 | 2.53 | 2.62 | 3.41 | 2.08 | 1.85 | 2.22 | 1.57 | |
| 2008 | 2.12 | 3.05 | 2.9 | 2.44 | 3.26 | 2.08 | 1.89 | |||
| 2007 | 2.02 | 2.88 | 2.47 | 3.34 | 1.72 | 2.05 | ||||
| 2006 | 3.34 | 2.89 | 2.55 | 2.45 | 3.26 | 1.76 | 2.01 | 1.99 | ||
| 2005 | 1.89 | 2.99 | 2.52 | 2.45 | 3.27 | 1.75 | 1.99 | 1.9 | ||
| 2004 | 2.39 | 3.3 | 1.79 | 1.97 | 1.83 | |||||
| 2003 | 1.75 | |||||||||
| 2002 | 1.65 | |||||||||
| 2001 | ||||||||||
| 2000 | ||||||||||
| 1999 | ||||||||||
| 1998 | ||||||||||
| 1997 | ||||||||||
| 1996 | ||||||||||
| 1995 | ||||||||||
| 1994 | ||||||||||
| 1993 | ||||||||||
| 1992 | ||||||||||
| 1991 | ||||||||||
| 1990 | ||||||||||


Comments