
Abstract
Historically, the ratio of male to female births has remained fairly consistent worldwide, typically around 1.05 male births for every female. However, some countries, particularly those with advanced healthcare systems, show slight fluctuations in these rates. Liechtenstein’s 1.16% rate of male births per female for 2050 reflects a small but notable deviation from the global norm, potentially linked to specific demographic patterns or regional healthcare factors. While small, these variations can highlight broader trends in population dynamics and sex ratios.
Number of male births (per female birth)
Since 1960, global birth ratios of boys to girls have generally hovered around 1.05, but regional variations exist. Liechtenstein recorded its highest male-to-female birth ratio in 2015 at 1.28%, a notable peak that reflects unique demographic or health factors. Currently, the country stands at 90.7% of this peak, indicating a slight decline. This trend mirrors broader shifts in birth patterns influenced by factors such as healthcare improvements, economic changes, and social dynamics. Despite fluctuations, the global average remains relatively stable, with slight regional disparities marking specific countries.
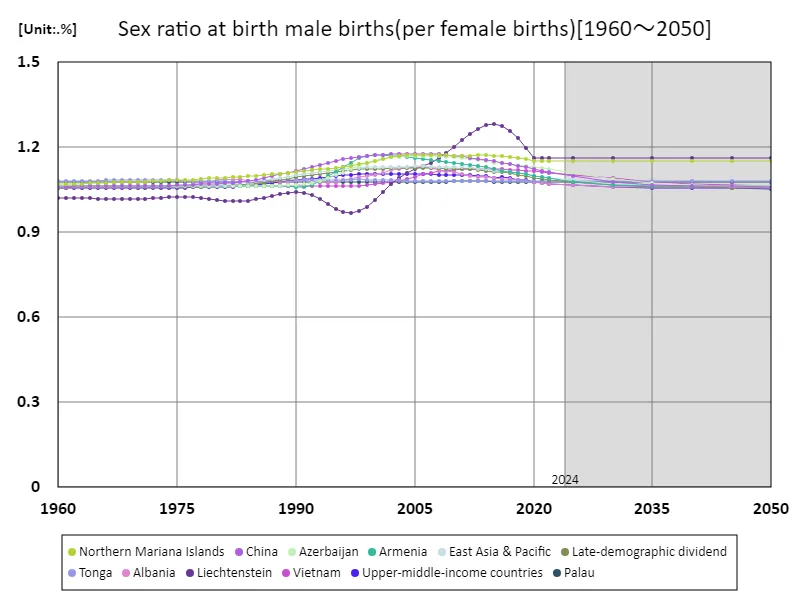
The maximum is 1.28%[2015] of Liechtenstein, and the current value is about 90.7%
Number of boys born per girl born (Worldwide)
From 1960 to 2050, the male-to-female birth ratio globally has remained close to 1.05, but with some regional variations. Liechtenstein reached its highest ratio of 1.28% in 2015, likely influenced by local demographic and healthcare factors. Currently, the country stands at 90.7% of this peak, suggesting a slight decline in the ratio since its high point. This trend is part of broader global shifts in population dynamics, where advanced healthcare and social factors have influenced gender birth ratios, though overall, the global sex ratio at birth remains stable.
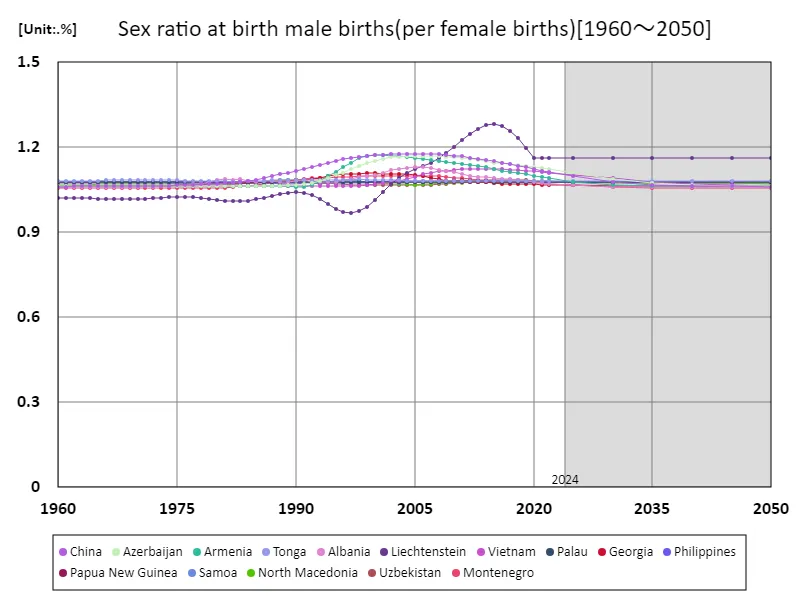
The maximum is 1.28%[2015] of Liechtenstein, and the current value is about 90.7%
Number of male births per female birth (world, latest year)
As of 2050, the global male-to-female birth ratio remains around 1.05%, with Liechtenstein recording the highest ratio at 1.16%, which is 197% of the global average. Historically, the sex ratio at birth has remained relatively stable, with slight variations influenced by regional and healthcare factors. Liechtenstein’s higher ratio reflects unique demographic trends, possibly driven by small population sizes and specific health policies. While global trends show a steady average, these fluctuations highlight the complexity of birth ratios, shaped by social, economic, and healthcare influences.
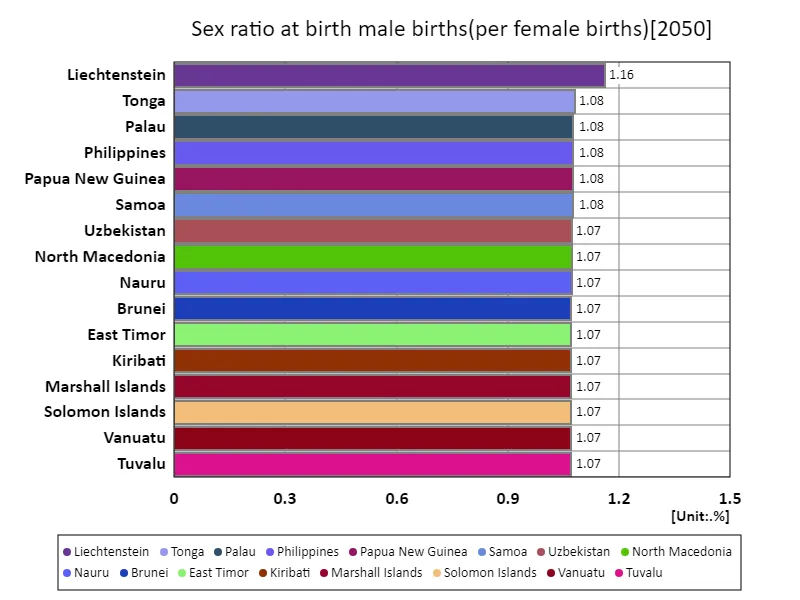
The maximum is 1.16% of Liechtenstein, the average is 1.05%, and the total is 195%
Number of male births (per female birth) (region, latest year)
The global male-to-female birth ratio is typically around 1.05, with slight regional variations. For 2050, East Asia and the Pacific region lead with a ratio of 1.06, reflecting cultural and social influences, such as a preference for male children in certain countries. These preferences, often linked to economic or traditional factors, contribute to the higher sex ratios observed in this region. The global total of 15.7% highlights how regional differences impact the overall average. While birth sex ratios remain stable in many areas, they can vary significantly due to socio-economic and cultural factors, particularly in regions like East Asia.
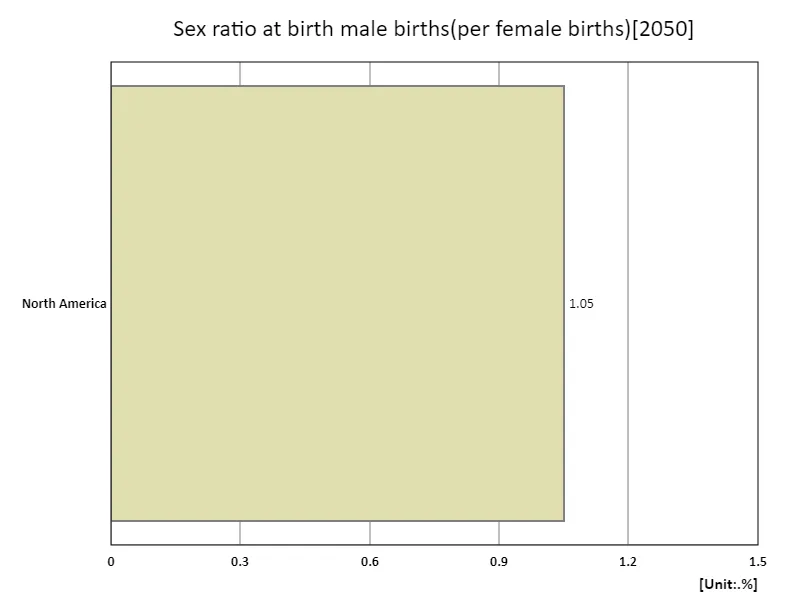
The maximum is 1.05% of North America, the average is 1.05%, and the total is 1.05%
Main data
| Sex ratio at birth male births(per female births, Birth and Life expectancy) [%] | ||||||||||
|---|---|---|---|---|---|---|---|---|---|---|
| Liechtenstein | Northern Mariana Islands | Tonga | Palau | Philippines | Papua New Guinea | Samoa | Uzbekistan | Nauru | North Macedonia | |
| 2050.0 | 1.16 | 1.15 | 1.08 | 1.08 | 1.08 | 1.08 | 1.08 | 1.07 | 1.07 | 1.07 |
| 2046.0 | ||||||||||
| 2045.0 | 1.16 | 1.15 | 1.08 | 1.08 | 1.08 | 1.08 | 1.08 | 1.07 | 1.07 | 1.07 |
| 2041.0 | ||||||||||
| 2040.0 | 1.16 | 1.15 | 1.08 | 1.08 | 1.08 | 1.08 | 1.08 | 1.07 | 1.07 | 1.07 |
| 2036.0 | ||||||||||
| 2035.0 | 1.16 | 1.15 | 1.08 | 1.08 | 1.08 | 1.08 | 1.08 | 1.07 | 1.07 | 1.07 |
| 2031.0 | ||||||||||
| 2030.0 | 1.16 | 1.15 | 1.08 | 1.08 | 1.08 | 1.08 | 1.08 | 1.08 | 1.07 | 1.07 |
| 2026.0 | ||||||||||
| 2025.0 | 1.16 | 1.15 | 1.08 | 1.08 | 1.08 | 1.08 | 1.08 | 1.08 | 1.07 | 1.08 |
| 2023.0 | ||||||||||
| 2022.0 | 1.16 | 1.15 | 1.08 | 1.08 | 1.08 | 1.08 | 1.08 | 1.08 | 1.07 | 1.08 |
| 2021.0 | 1.16 | 1.15 | 1.08 | 1.08 | 1.08 | 1.08 | 1.08 | 1.08 | 1.07 | 1.08 |
| 2020.0 | 1.16 | 1.15 | 1.08 | 1.08 | 1.08 | 1.08 | 1.08 | 1.08 | 1.07 | 1.08 |
| 2019.0 | 1.2 | 1.16 | 1.08 | 1.08 | 1.08 | 1.08 | 1.08 | 1.08 | 1.07 | 1.08 |
| 2018.0 | 1.23 | 1.16 | 1.08 | 1.08 | 1.08 | 1.08 | 1.08 | 1.09 | 1.07 | 1.08 |
| 2017.0 | 1.26 | 1.17 | 1.08 | 1.08 | 1.08 | 1.08 | 1.08 | 1.09 | 1.07 | 1.08 |
| 2016.0 | 1.28 | 1.17 | 1.08 | 1.08 | 1.08 | 1.08 | 1.08 | 1.08 | 1.07 | 1.08 |
| 2015.0 | 1.28 | 1.17 | 1.08 | 1.08 | 1.08 | 1.08 | 1.08 | 1.08 | 1.07 | 1.08 |
| 2014.0 | 1.28 | 1.17 | 1.08 | 1.08 | 1.08 | 1.08 | 1.08 | 1.08 | 1.07 | 1.08 |
| 2013.0 | 1.27 | 1.17 | 1.08 | 1.08 | 1.08 | 1.08 | 1.08 | 1.08 | 1.07 | 1.08 |
| 2012.0 | 1.25 | 1.17 | 1.08 | 1.08 | 1.08 | 1.08 | 1.08 | 1.08 | 1.07 | 1.08 |
| 2011.0 | 1.23 | 1.17 | 1.08 | 1.08 | 1.08 | 1.08 | 1.08 | 1.08 | 1.07 | 1.08 |
| 2010.0 | 1.2 | 1.17 | 1.08 | 1.08 | 1.08 | 1.08 | 1.08 | 1.08 | 1.07 | 1.08 |
| 2009.0 | 1.18 | 1.17 | 1.08 | 1.08 | 1.08 | 1.08 | 1.08 | 1.07 | 1.07 | 1.08 |
| 2008.0 | 1.16 | 1.17 | 1.08 | 1.08 | 1.08 | 1.08 | 1.08 | 1.07 | 1.07 | 1.07 |
| 2007.0 | 1.15 | 1.17 | 1.08 | 1.08 | 1.08 | 1.08 | 1.08 | 1.07 | 1.07 | 1.07 |
| 2006.0 | 1.13 | 1.17 | 1.08 | 1.08 | 1.08 | 1.08 | 1.08 | 1.07 | 1.07 | 1.07 |
| 2005.0 | 1.12 | 1.17 | 1.08 | 1.08 | 1.08 | 1.08 | 1.08 | 1.07 | 1.07 | 1.07 |
| 2004.0 | 1.11 | 1.17 | 1.08 | 1.08 | 1.08 | 1.08 | 1.08 | 1.07 | 1.07 | 1.07 |
| 2003.0 | 1.09 | 1.17 | 1.08 | 1.08 | 1.08 | 1.08 | 1.08 | 1.07 | 1.07 | 1.07 |
| 2002.0 | 1.07 | 1.17 | 1.08 | 1.08 | 1.08 | 1.08 | 1.08 | 1.07 | 1.07 | 1.07 |
| 2001.0 | 1.04 | 1.16 | 1.08 | 1.08 | 1.08 | 1.08 | 1.08 | 1.07 | 1.07 | 1.08 |
| 2000.0 | 1.01 | 1.15 | 1.09 | 1.08 | 1.08 | 1.08 | 1.08 | 1.07 | 1.07 | 1.08 |
| 1999.0 | 0.99 | 1.15 | 1.09 | 1.08 | 1.08 | 1.08 | 1.08 | 1.07 | 1.07 | 1.08 |
| 1998.0 | 0.97 | 1.14 | 1.09 | 1.08 | 1.08 | 1.08 | 1.07 | 1.07 | 1.07 | 1.08 |
| 1997.0 | 0.97 | 1.13 | 1.09 | 1.08 | 1.08 | 1.08 | 1.07 | 1.07 | 1.07 | 1.08 |
| 1996.0 | 0.97 | 1.13 | 1.09 | 1.08 | 1.08 | 1.08 | 1.07 | 1.07 | 1.07 | 1.08 |
| 1995.0 | 0.98 | 1.13 | 1.09 | 1.08 | 1.08 | 1.08 | 1.07 | 1.07 | 1.07 | 1.08 |
| 1994.0 | 1 | 1.12 | 1.08 | 1.08 | 1.08 | 1.08 | 1.08 | 1.07 | 1.07 | 1.08 |
| 1993.0 | 1.02 | 1.12 | 1.09 | 1.08 | 1.08 | 1.08 | 1.08 | 1.07 | 1.07 | 1.08 |
| 1992.0 | 1.03 | 1.12 | 1.09 | 1.08 | 1.08 | 1.08 | 1.08 | 1.07 | 1.07 | 1.08 |
| 1991.0 | 1.04 | 1.12 | 1.09 | 1.08 | 1.07 | 1.08 | 1.08 | 1.08 | 1.07 | 1.08 |
| 1990.0 | 1.04 | 1.11 | 1.09 | 1.08 | 1.07 | 1.08 | 1.08 | 1.08 | 1.07 | 1.09 |
| 1989.0 | 1.04 | 1.11 | 1.09 | 1.08 | 1.07 | 1.08 | 1.08 | 1.08 | 1.07 | 1.09 |
| 1988.0 | 1.03 | 1.11 | 1.08 | 1.08 | 1.07 | 1.08 | 1.08 | 1.08 | 1.07 | 1.08 |
| 1987.0 | 1.03 | 1.1 | 1.08 | 1.08 | 1.07 | 1.08 | 1.08 | 1.08 | 1.07 | 1.08 |
| 1986.0 | 1.02 | 1.1 | 1.08 | 1.08 | 1.07 | 1.08 | 1.08 | 1.08 | 1.07 | 1.08 |
| 1985.0 | 1.02 | 1.1 | 1.08 | 1.08 | 1.08 | 1.08 | 1.08 | 1.08 | 1.07 | 1.08 |
| 1984.0 | 1.01 | 1.1 | 1.08 | 1.08 | 1.08 | 1.08 | 1.08 | 1.08 | 1.07 | 1.07 |
| 1983.0 | 1.01 | 1.1 | 1.08 | 1.08 | 1.08 | 1.08 | 1.08 | 1.08 | 1.07 | 1.07 |
| 1982.0 | 1.01 | 1.1 | 1.08 | 1.08 | 1.07 | 1.08 | 1.08 | 1.08 | 1.07 | 1.07 |
| 1981.0 | 1.01 | 1.09 | 1.08 | 1.08 | 1.08 | 1.08 | 1.08 | 1.08 | 1.07 | 1.07 |
| 1980.0 | 1.01 | 1.09 | 1.08 | 1.08 | 1.07 | 1.08 | 1.08 | 1.08 | 1.07 | 1.07 |
| 1979.0 | 1.02 | 1.09 | 1.08 | 1.08 | 1.07 | 1.08 | 1.08 | 1.08 | 1.07 | 1.07 |
| 1978.0 | 1.02 | 1.09 | 1.08 | 1.08 | 1.07 | 1.08 | 1.08 | 1.08 | 1.07 | 1.07 |
| 1977.0 | 1.02 | 1.09 | 1.08 | 1.08 | 1.08 | 1.08 | 1.08 | 1.08 | 1.07 | 1.07 |
| 1976.0 | 1.02 | 1.09 | 1.08 | 1.08 | 1.08 | 1.08 | 1.08 | 1.08 | 1.07 | 1.07 |
| 1975.0 | 1.02 | 1.08 | 1.08 | 1.08 | 1.08 | 1.08 | 1.08 | 1.08 | 1.07 | 1.07 |
| 1974.0 | 1.02 | 1.08 | 1.08 | 1.08 | 1.08 | 1.08 | 1.08 | 1.08 | 1.07 | 1.07 |
| 1973.0 | 1.02 | 1.08 | 1.08 | 1.08 | 1.08 | 1.08 | 1.08 | 1.08 | 1.07 | 1.07 |
| 1972.0 | 1.02 | 1.08 | 1.08 | 1.08 | 1.08 | 1.08 | 1.08 | 1.07 | 1.07 | 1.07 |
| 1971.0 | 1.02 | 1.08 | 1.09 | 1.08 | 1.08 | 1.08 | 1.08 | 1.08 | 1.07 | 1.07 |
| 1970.0 | 1.02 | 1.08 | 1.08 | 1.08 | 1.08 | 1.08 | 1.08 | 1.07 | 1.07 | 1.07 |
| 1969.0 | 1.02 | 1.08 | 1.08 | 1.08 | 1.08 | 1.08 | 1.08 | 1.07 | 1.07 | 1.07 |
| 1968.0 | 1.02 | 1.08 | 1.08 | 1.08 | 1.08 | 1.08 | 1.08 | 1.07 | 1.07 | 1.07 |
| 1967.0 | 1.02 | 1.08 | 1.08 | 1.08 | 1.08 | 1.08 | 1.08 | 1.07 | 1.07 | 1.07 |
| 1966.0 | 1.02 | 1.08 | 1.08 | 1.08 | 1.08 | 1.08 | 1.08 | 1.07 | 1.07 | 1.07 |
| 1965.0 | 1.02 | 1.07 | 1.08 | 1.08 | 1.08 | 1.08 | 1.08 | 1.07 | 1.07 | 1.07 |
| 1964.0 | 1.02 | 1.07 | 1.08 | 1.08 | 1.08 | 1.08 | 1.08 | 1.07 | 1.07 | 1.07 |
| 1963.0 | 1.02 | 1.07 | 1.08 | 1.08 | 1.08 | 1.08 | 1.08 | 1.07 | 1.07 | 1.07 |
| 1962.0 | 1.02 | 1.07 | 1.08 | 1.08 | 1.08 | 1.08 | 1.08 | 1.07 | 1.07 | 1.07 |
| 1961.0 | 1.02 | 1.07 | 1.08 | 1.08 | 1.08 | 1.08 | 1.08 | 1.07 | 1.07 | 1.07 |
| 1960.0 | 1.02 | 1.07 | 1.08 | 1.08 | 1.08 | 1.08 | 1.08 | 1.07 | 1.07 | 1.07 |

Comments