
Abstract
Global GDP, measured in purchasing power parity (PPP) and US dollars, has seen significant growth over the past few decades. From the early 2000s, the world economy expanded due to rising industrialization in emerging markets, particularly in China and India. By 2023, global GDP reached a record high of 185 trillion USD. This growth reflects both increased productivity and higher consumption, driven by globalization and technological advancement. However, disparities remain, with developed countries still leading in GDP per capita, while developing nations continue to close the gap in overall economic output.
GDP, US dollars
Since 1990, global GDP (PPP) in current USD has seen remarkable growth, reaching a peak of 185 trillion USD in 2023. This surge reflects global economic integration, technological advances, and the rise of emerging markets, particularly in Asia. Developing nations, especially China and India, have contributed significantly, narrowing the gap with advanced economies. Despite challenges like recessions and inflation, the world economy has grown more interconnected, with GDP growth driven by both consumption and production across diverse regions. In 2023, the global economy stands at its highest point, marking a culmination of decades of expansion.
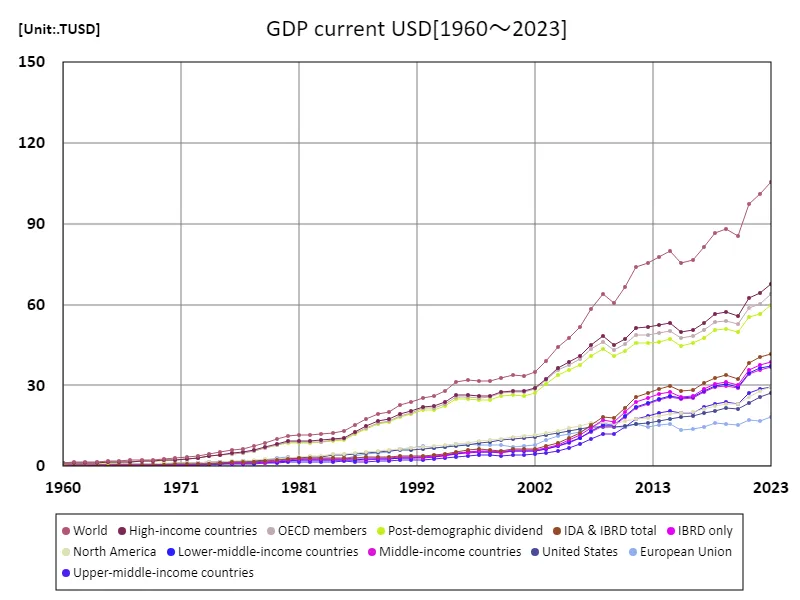
The maximum is the latest one, 105TUSD of World
GDP, US Dollars (Worldwide)
Since 1990, China’s GDP (PPP) in current USD has experienced exceptional growth, reaching a record 34.6 trillion USD in 2023. This marks China at 100% of its peak, driven by rapid industrialization, export growth, and substantial investments in infrastructure and technology. Over the past few decades, China has transitioned from a largely agrarian economy to the world’s second-largest economy, contributing significantly to global growth. Its rise has been pivotal in shaping the global economy, with China becoming a key player in trade, manufacturing, and consumption on the world stage.
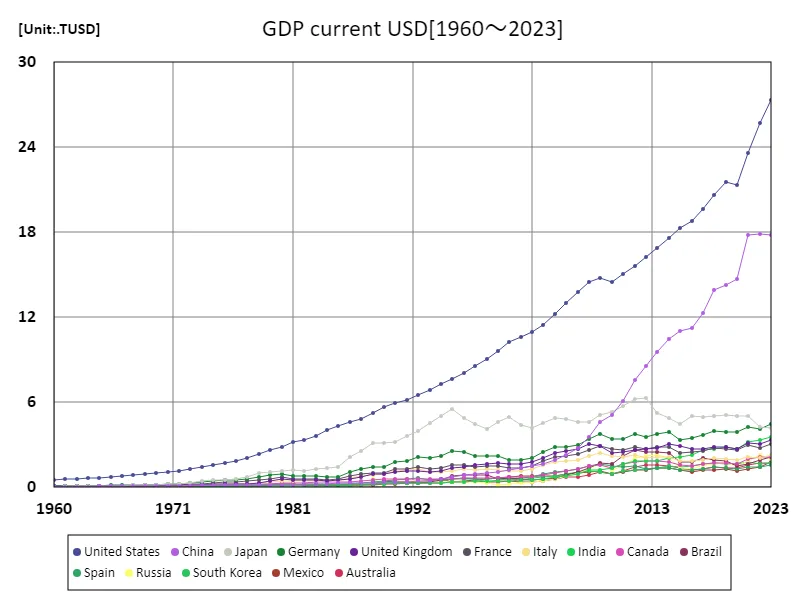
The maximum is the latest one, 27.4TUSD of United States
GDP, US Dollars (World Countries, Latest Year)
As of 2023, China leads the world economy with a GDP (PPP) of 34.6 trillion USD, contributing significantly to global growth. The world’s total GDP (PPP) stands at 180 trillion USD, with an average of 1.01 trillion USD per country. Over the past few decades, China’s rapid industrialization, technological advancements, and global trade expansion have propelled it to this dominant position. Emerging markets have also contributed to global growth, narrowing economic gaps. The world’s increasing interconnectedness and shifting economic power reflect the growing importance of developing nations in the global economy.
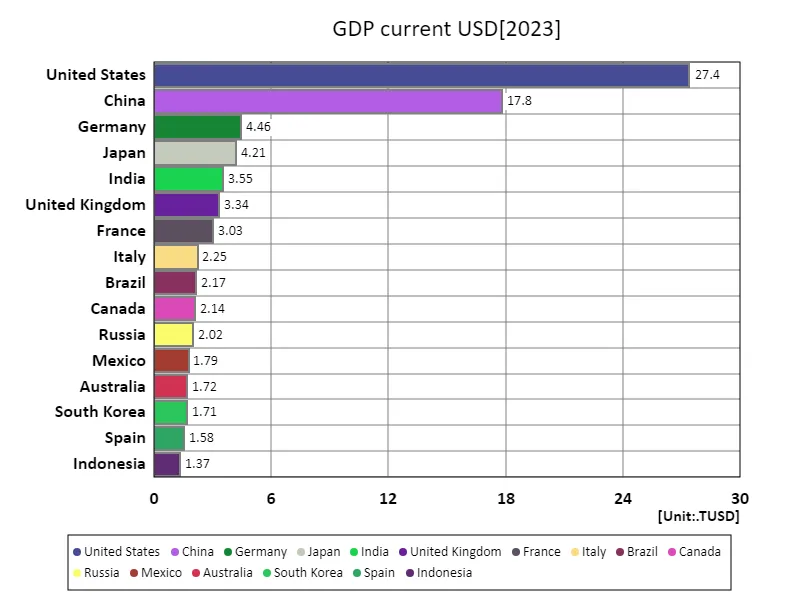
The maximum is 27.4TUSD of United States, the average is 577GUSD, and the total is 103TUSD
GDP, US dollars (region, latest year)
In 2023, North America’s GDP reached $29.5 trillion, the largest in the global economy, accounting for about 26% of the total $113 trillion. This highlights North America’s central role in global economic activity. The average global GDP of $7.52 trillion emphasizes the regional disparities in economic size, with North America well above this average. While the global economy continues to grow, disparities persist, with developed economies maintaining significant size and emerging markets, particularly China and India, experiencing rapid growth. These shifts are reshaping the global economic structure, requiring adaptive strategies and policies for the future.
The maximum is 29.5TUSD of North America, the average is 29.5TUSD, and the total is 29.5TUSD
Main data
| GDP current USD [TUSD] | ||||||||||
|---|---|---|---|---|---|---|---|---|---|---|
| World | High-income countries | OECD members | Post-demographic dividend | IDA & IBRD total | IBRD only | Lower-middle-income countries | Middle-income countries | North America | Upper-middle-income countries | |
| 2023 | 105.44 | 67.65 | 64.1 | 59.85 | 41.56 | 38.73 | 37.43 | 36.79 | 29.51 | 29.4 |
| 2022 | 101.23 | 64.44 | 60.17 | 56.56 | 40.57 | 37.73 | 36.44 | 35.91 | 27.91 | 28.57 |
| 2021 | 97.53 | 62.46 | 58.9 | 55.59 | 38.38 | 35.74 | 34.73 | 34.27 | 25.61 | 27.37 |
| 2020 | 85.58 | 55.79 | 52.85 | 50 | 32.53 | 30.1 | 29.49 | 29.05 | 22.99 | 22.97 |
| 2019 | 87.95 | 57.22 | 54.05 | 51.02 | 33.72 | 31.25 | 30.42 | 29.98 | 23.27 | 23.7 |
| 2018 | 86.69 | 56.68 | 53.53 | 50.5 | 32.96 | 30.58 | 29.7 | 29.28 | 22.39 | 23.3 |
| 2017 | 81.55 | 53.34 | 50.61 | 47.67 | 30.96 | 28.75 | 27.93 | 27.53 | 21.27 | 21.84 |
| 2016 | 76.59 | 50.74 | 48.46 | 45.69 | 28.17 | 26.03 | 25.59 | 25.2 | 20.34 | 19.91 |
| 2015 | 75.36 | 49.77 | 47.54 | 44.67 | 27.99 | 25.84 | 25.33 | 24.91 | 19.86 | 19.83 |
| 2014 | 79.89 | 53.31 | 50.39 | 47.21 | 29.8 | 27.59 | 26.1 | 25.68 | 19.42 | 20.59 |
| 2013 | 77.75 | 52.44 | 49.36 | 46.27 | 28.74 | 26.69 | 24.94 | 24.55 | 18.73 | 19.83 |
| 2012 | 75.6 | 51.71 | 48.68 | 45.78 | 27.19 | 25.3 | 23.51 | 23.13 | 18.09 | 18.67 |
| 2011 | 73.96 | 51.52 | 48.72 | 45.85 | 25.59 | 23.81 | 22.12 | 21.71 | 17.4 | 17.5 |
| 2010 | 66.51 | 47.34 | 45.3 | 42.69 | 21.69 | 20.11 | 18.78 | 18.41 | 16.67 | 14.63 |
| 2009 | 60.72 | 44.94 | 43.18 | 40.93 | 17.91 | 16.54 | 15.45 | 15.11 | 15.86 | 11.97 |
| 2008 | 64.07 | 48.34 | 46.17 | 43.48 | 18.47 | 17.06 | 15.42 | 15.08 | 16.33 | 12.07 |
| 2007 | 58.31 | 45.1 | 43.48 | 41.04 | 15.4 | 14.22 | 12.98 | 12.7 | 15.95 | 9.98 |
| 2006 | 51.75 | 40.99 | 39.72 | 37.6 | 12.46 | 11.45 | 10.58 | 10.35 | 15.14 | 8.12 |
| 2005 | 47.76 | 38.62 | 37.65 | 35.74 | 10.5 | 9.66 | 8.99 | 8.79 | 14.22 | 6.89 |
| 2004 | 44.12 | 36.39 | 35.61 | 33.97 | 8.81 | 8.09 | 7.61 | 7.44 | 13.25 | 5.8 |
| 2003 | 39.15 | 32.57 | 31.99 | 30.57 | 7.41 | 6.79 | 6.49 | 6.35 | 12.36 | 4.91 |
| 2002 | 34.92 | 29.02 | 28.6 | 27.27 | 6.59 | 6.04 | 5.8 | 5.67 | 11.69 | 4.41 |
| 2001 | 33.63 | 27.81 | 27.42 | 26.14 | 6.47 | 5.95 | 5.69 | 5.57 | 11.32 | 4.37 |
| 2000 | 33.84 | 28.04 | 27.67 | 26.4 | 6.39 | 5.87 | 5.68 | 5.56 | 11 | 4.37 |
| 1999 | 32.73 | 27.4 | 27.07 | 25.95 | 5.85 | 5.4 | 5.22 | 5.12 | 10.31 | 4 |
| 1998 | 31.7 | 26.17 | 25.77 | 24.71 | 6.14 | 5.54 | 5.43 | 5.33 | 9.7 | 4.11 |
| 1997 | 31.75 | 26.21 | 25.51 | 24.6 | 6.27 | 5.69 | 5.45 | 5.35 | 9.24 | 4.16 |
| 1996 | 31.86 | 26.64 | 25.9 | 25.1 | 5.92 | 5.37 | 5.14 | 5.04 | 8.71 | 3.91 |
| 1995 | 31.14 | 26.43 | 25.68 | 24.98 | 5.4 | 4.92 | 4.63 | 4.53 | 8.25 | 3.53 |
| 1994 | 27.94 | 23.82 | 23.3 | 22.51 | 4.73 | 4.34 | 4.06 | 3.96 | 7.87 | 3.12 |
| 1993 | 25.96 | 22.27 | 21.8 | 21.02 | 4.32 | 3.93 | 3.62 | 3.52 | 7.44 | 2.77 |
| 1992 | 25.47 | 22.12 | 21.46 | 20.87 | 3.99 | 3.62 | 3.28 | 3.18 | 7.12 | 2.44 |
| 1991 | 23.82 | 20.66 | 19.95 | 19.45 | 3.86 | 3.45 | 3.1 | 2.96 | 6.77 | 2.26 |
| 1990 | 22.82 | 19.58 | 18.85 | 18.44 | 3.94 | 3.56 | 3.19 | 3.07 | 6.56 | 2.33 |
| 1989 | 20.32 | 17.48 | 16.74 | 16.43 | 3.52 | 3.17 | 2.8 | 2.69 | 6.21 | 2.01 |
| 1988 | 19.55 | 16.79 | 16 | 15.74 | 3.49 | 3.16 | 2.7 | 2.61 | 5.75 | 1.9 |
| 1987 | 17.49 | 14.91 | 14.19 | 13.97 | 3.28 | 2.96 | 2.54 | 2.45 | 5.29 | 1.76 |
| 1986 | 15.35 | 12.86 | 12.25 | 12.05 | 3.21 | 2.91 | 2.48 | 2.4 | 4.96 | 1.78 |
| 1985 | 13.02 | 10.59 | 10.11 | 9.86 | 3.21 | 2.86 | 2.48 | 2.4 | 4.71 | 1.78 |
| 1984 | 12.45 | 10.09 | 9.6 | 9.36 | 3.11 | 2.77 | 2.4 | 2.32 | 4.4 | 1.75 |
| 1983 | 11.97 | 9.68 | 9.19 | 8.96 | 3.04 | 2.67 | 2.33 | 2.25 | 3.98 | 1.64 |
| 1982 | 11.65 | 9.37 | 8.89 | 8.64 | 3.05 | 2.6 | 2.33 | 2.25 | 3.66 | 1.59 |
| 1981 | 11.8 | 9.46 | 9.03 | 8.68 | 3.15 | 2.68 | 2.4 | 2.32 | 3.52 | 1.66 |
| 1980 | 11.42 | 9.32 | 8.87 | 8.58 | 2.79 | 2.5 | 2.12 | 2.05 | 3.13 | 1.54 |
| 1979 | 10.11 | 8.35 | 7.98 | 7.75 | 2.3 | 2.05 | 1.76 | 1.69 | 2.87 | 1.28 |
| 1978 | 8.7 | 7.22 | 6.92 | 6.75 | 1.9 | 1.69 | 1.46 | 1.4 | 2.57 | 1.04 |
| 1977 | 7.36 | 6.02 | 5.74 | 5.6 | 1.76 | 1.57 | 1.35 | 1.3 | 2.29 | 0.98 |
| 1976 | 6.51 | 5.32 | 5.09 | 4.96 | 1.56 | 1.38 | 1.2 | 1.16 | 2.08 | 0.88 |
| 1975 | 5.99 | 4.88 | 4.7 | 4.57 | 1.45 | 1.28 | 1.13 | 1.08 | 1.86 | 0.82 |
| 1974 | 5.36 | 4.37 | 4.19 | 4.08 | 1.31 | 1.17 | 1 | 0.96 | 1.71 | 0.71 |
| 1973 | 4.66 | 3.87 | 3.74 | 3.65 | 1.04 | 0.94 | 0.79 | 0.76 | 1.56 | 0.56 |
| 1972 | 3.83 | 3.19 | 3.09 | 3.02 | 0.83 | 0.74 | 0.64 | 0.61 | 1.39 | 0.44 |
| 1971 | 3.32 | 2.75 | 2.66 | 2.6 | 0.75 | 0.66 | 0.57 | 0.55 | 1.26 | 0.38 |
| 1970 | 3 | 2.47 | 2.4 | 2.34 | 0.7 | 0.61 | 0.53 | 0.51 | 1.16 | 0.35 |
| 1969 | 2.74 | 2.25 | 2.19 | 2.13 | 0.64 | 0.56 | 0.49 | 0.47 | 1.1 | 0.32 |
| 1968 | 2.48 | 2.04 | 1.99 | 1.94 | 0.57 | 0.5 | 0.44 | 0.42 | 1.01 | 0.29 |
| 1967 | 2.29 | 1.88 | 1.83 | 1.79 | 0.54 | 0.47 | 0.41 | 0.4 | 0.93 | 0.27 |
| 1966 | 2.15 | 1.76 | 1.71 | 1.67 | 0.52 | 0.46 | 0.4 | 0.38 | 0.87 | 0.27 |
| 1965 | 1.99 | 1.61 | 1.57 | 1.53 | 0.51 | 0.45 | 0.39 | 0.38 | 0.8 | 0.24 |
| 1964 | 1.83 | 1.48 | 1.44 | 1.4 | 0.47 | 0.41 | 0.35 | 0.34 | 0.73 | 0.22 |
| 1963 | 1.66 | 1.36 | 1.32 | 1.29 | 0.41 | 0.36 | 0.31 | 0.3 | 0.68 | 0.19 |
| 1962 | 1.54 | 1.26 | 1.22 | 1.19 | 0.38 | 0.33 | 0.28 | 0.27 | 0.65 | 0.17 |
| 1961 | 1.44 | 1.17 | 1.13 | 1.1 | 0.37 | 0.32 | 0.28 | 0.27 | 0.6 | 0.17 |
| 1960 | 1.36 | 1.09 | 1.06 | 1.04 | 0.37 | 0.33 | 0.28 | 0.27 | 0.58 | 0.18 |

Comments