
Abstract
Angola’s 13.6% inflation rate in 2023 marks a continuation of the country’s volatility in consumer prices. Historically, Angola has faced significant inflation due to factors such as oil price fluctuations, currency devaluation, and economic instability. In the past decade, inflation has been characterized by sharp spikes, peaking around 40% in 2016 due to an oil price crash, before gradually stabilizing. Despite efforts to diversify its economy, inflation remains persistent, driven by high reliance on imports, exchange rate pressures, and public sector spending.
Inflation consumer prices
Congo and the Dominican Republic experienced extreme inflation in 1994, with wholesale price index inflation peaking at 23.8k%. These historical spikes were driven by severe economic crises, including political instability, hyperinflation, and fiscal mismanagement. Since then, both countries have faced long periods of recovery, with inflation gradually stabilizing but remaining vulnerable to external shocks. Currently, their inflation rates stand at a staggering 12.1 million percent of the 1994 peak, reflecting the challenges of controlling inflation amidst volatile political and economic environments.
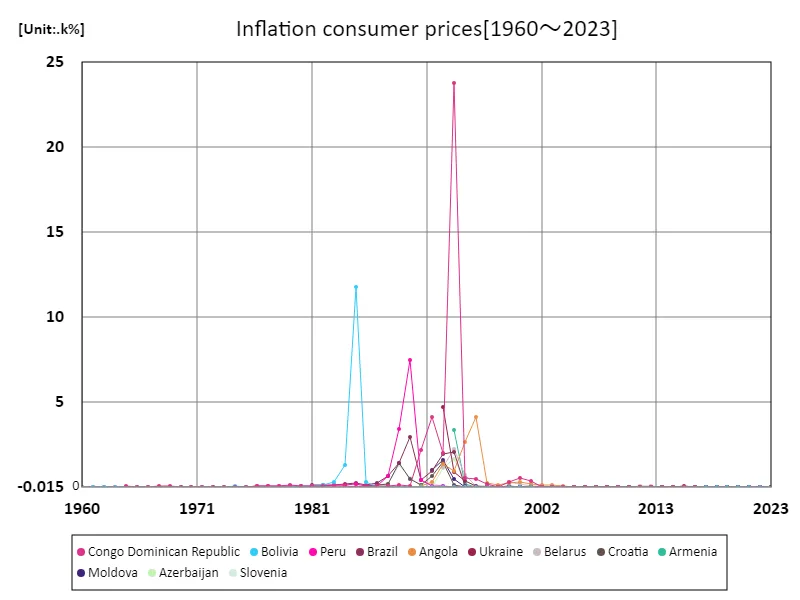
The maximum is 23.8k%[1994] of Congo Dominican Republic, and the current value is about 12.1m%
Inflation Consumer Prices (Worldwide)
Bolivia’s peak inflation of 11.7k% in 1985 was driven by a severe economic crisis, including high public debt, political instability, and the collapse of the local currency. This hyperinflation led to drastic measures, such as currency stabilization programs and economic reforms. Since then, Bolivia has experienced significant stabilization, with inflation largely under control in recent decades. However, the current rate of 21.9 million percent compared to the 1985 peak highlights the lingering effects of past economic shocks and challenges in achieving consistent price stability.
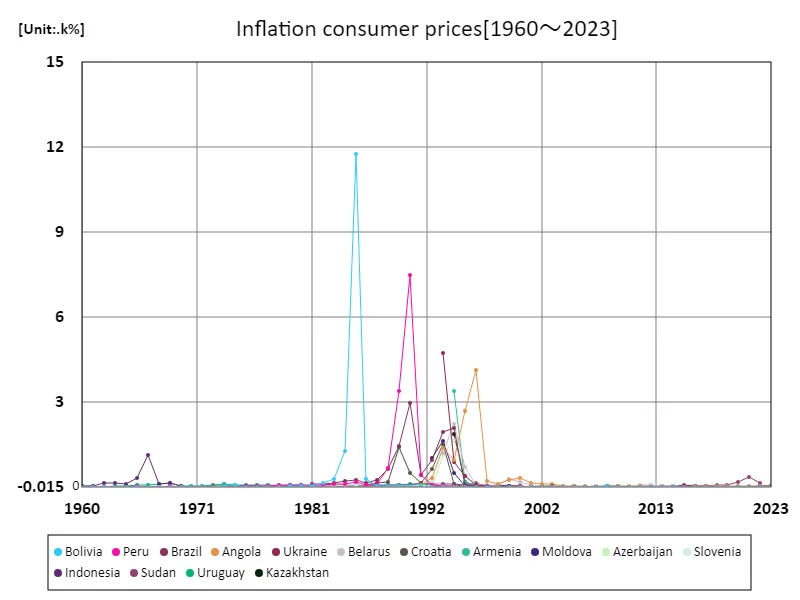
The maximum is 11.7k%[1985] of Bolivia, and the current value is about 21.9m%
Inflation Consumer Price Index (World Countries, Latest Year)
Lebanon’s inflation rate of 221% in 2023 reflects the ongoing economic crisis, which has been exacerbated by political instability, a collapsing currency, and the aftermath of the 2019 financial meltdown. This is starkly higher than the global average of around 10%. Since the crisis began, inflation has soared, reaching a total of 1.49k% over the period. Lebanon’s economy has struggled with severe currency depreciation, rising poverty, and a loss of public trust in financial institutions. Efforts to stabilize the economy remain challenging, as reforms and international assistance are slow to materialize.
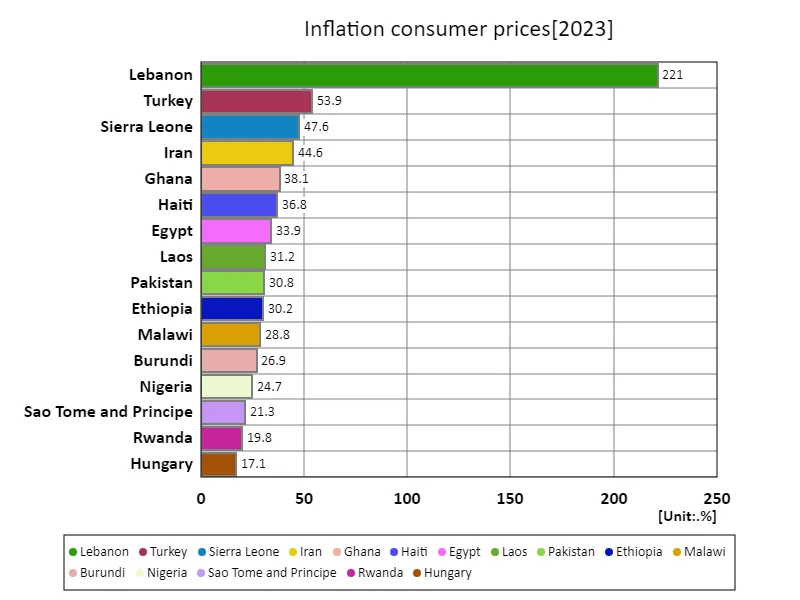
The maximum is 221% of Lebanon, the average is 10.1%, and the total is 1.49k%
Inflation Consumer Price Index (region, latest year)
In 2023, Europe and Central Asia recorded a high inflation rate of 9.44%, surpassing the regional average of 6.12%. This increase is largely driven by the economic fallout from the war in Ukraine, supply chain disruptions, and rising energy prices. Historically, the region has experienced inflation rates averaging 91.8% over time, with varying degrees of volatility influenced by geopolitical tensions, currency fluctuations, and economic reforms. While some countries have stabilized, others continue to face inflationary pressures, highlighting the challenges of managing economic recovery and price stability in a complex environment.
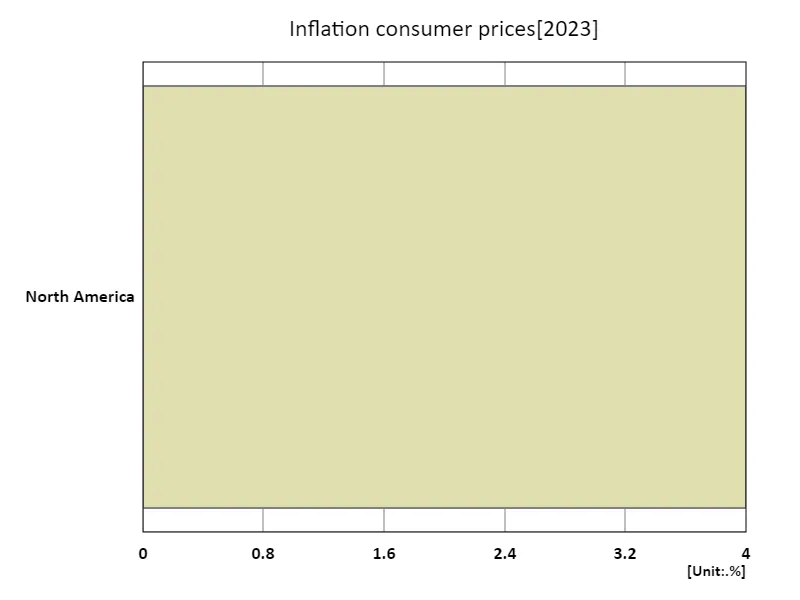
The maximum is 4% of North America, the average is 4%, and the total is 4%
Main data
| Inflation consumer prices [%] | ||||||||||
|---|---|---|---|---|---|---|---|---|---|---|
| Lebanon | Turkey | Sierra Leone | Iran | Ghana | Haiti | Egypt | Laos | Pakistan | Ethiopia | |
| 2023 | 221.34 | 53.86 | 47.64 | 44.58 | 38.11 | 36.81 | 33.88 | 31.23 | 30.77 | 30.22 |
| 2022 | 171.21 | 72.31 | 27.21 | 43.49 | 31.26 | 33.98 | 13.9 | 22.96 | 19.87 | 33.89 |
| 2021 | 154.76 | 19.6 | 11.87 | 43.39 | 9.97 | 16.84 | 5.21 | 3.76 | 9.5 | 26.84 |
| 2020 | 84.86 | 12.28 | 13.45 | 30.59 | 9.89 | 22.8 | 5.04 | 5.1 | 9.74 | 20.36 |
| 2019 | 3.01 | 15.18 | 14.8 | 39.91 | 7.14 | 18.7 | 9.15 | 3.32 | 10.58 | 15.81 |
| 2018 | 6.08 | 16.33 | 16.03 | 18.01 | 7.81 | 12.48 | 14.4 | 2.04 | 5.08 | 13.83 |
| 2017 | 4.32 | 11.14 | 18.22 | 8.04 | 12.37 | 10.68 | 29.51 | 0.83 | 4.09 | 10.69 |
| 2016 | -0.78 | 7.78 | 10.89 | 7.25 | 17.45 | 11.5 | 13.81 | 1.6 | 3.77 | 6.63 |
| 2015 | -3.75 | 7.67 | 6.69 | 12.48 | 17.15 | 6.73 | 10.37 | 1.28 | 2.53 | 9.57 |
| 2014 | 1.85 | 8.85 | 4.64 | 16.61 | 15.49 | 3.44 | 10.07 | 4.13 | 7.19 | 6.89 |
| 2013 | 4.82 | 7.49 | 5.52 | 36.6 | 11.67 | 4.77 | 9.47 | 6.37 | 7.69 | 7.46 |
| 2012 | 6.58 | 8.89 | 6.59 | 27.26 | 11.19 | 5.02 | 7.11 | 4.26 | 9.68 | 23.6 |
| 2011 | 4.97 | 6.47 | 6.79 | 26.29 | 8.73 | 6.33 | 10.06 | 7.57 | 11.92 | 33.25 |
| 2010 | 3.98 | 8.57 | 7.19 | 10.09 | 10.73 | 4.83 | 11.27 | 5.98 | 12.94 | 8.15 |
| 2009 | 1.2 | 6.25 | 7.47 | 13.55 | 19.25 | 0.39 | 11.76 | 0.14 | 13.65 | 8.48 |
| 2008 | 10.44 | 8.21 | 25.41 | 16.49 | 15.28 | 18.32 | 7.63 | 20.29 | 44.36 | |
| 2007 | 8.76 | 11.65 | 17.34 | 10.73 | 6.56 | 9.32 | 4.66 | 7.6 | 17.24 | |
| 2006 | 9.6 | 10.02 | 11.68 | 11.35 | 7.64 | 6.55 | 7.92 | 12.3 | ||
| 2005 | 8.18 | 13.43 | 15.44 | 13.97 | 4.87 | 7.17 | 9.06 | 9.97 | ||
| 2004 | 8.6 | 14.76 | 18.04 | 21.03 | 11.27 | 10.46 | 7.44 | 3.33 | ||
| 2003 | 21.6 | 16.47 | 29.77 | 28.7 | 4.51 | 15.49 | 2.91 | 13.67 | ||
| 2002 | 44.96 | 14.34 | 9.36 | 7.03 | 2.74 | 10.63 | 3.29 | 0.68 | ||
| 2001 | 54.4 | 11.27 | 41.51 | 13.32 | 2.27 | 7.81 | 3.15 | -8.24 | ||
| 2000 | 54.92 | 14.48 | 40.24 | 9.33 | 2.68 | 25.08 | 4.37 | 0.66 | ||
| 1999 | 64.87 | 20.07 | 4.87 | 3 | 3.08 | 125.27 | 4.14 | 7.94 | ||
| 1998 | 84.64 | 17.87 | 14.62 | 5.27 | 3.87 | 90.98 | 6.23 | 0.89 | ||
| 1997 | 85.67 | 17.35 | 27.89 | 20.56 | 4.63 | 27.51 | 11.38 | 2.4 | ||
| 1996 | 80.41 | 28.94 | 46.56 | 20.58 | 7.19 | 13.02 | 10.37 | -8.48 | ||
| 1995 | 89.11 | 49.66 | 59.46 | 27.61 | 15.74 | 19.59 | 12.34 | 10.02 | ||
| 1994 | 105.21 | 31.45 | 24.87 | 39.33 | 8.15 | 6.78 | 12.37 | 7.59 | ||
| 1993 | 66.09 | 21.2 | 24.96 | 29.71 | 12.09 | 6.27 | 9.97 | 3.54 | ||
| 1992 | 70.08 | 25.81 | 10.06 | 19.36 | 13.64 | 9.86 | 9.51 | 10.53 | ||
| 1991 | 65.98 | 17.13 | 18.03 | 15.42 | 19.75 | 13.44 | 11.79 | 35.72 | ||
| 1990 | 60.3 | 7.63 | 37.26 | 21.28 | 16.76 | 35.64 | 9.05 | 5.15 | ||
| 1989 | 63.27 | 22.35 | 25.22 | 6.92 | 21.26 | 61.33 | 7.84 | 7.82 | ||
| 1988 | 68.81 | 28.67 | 31.36 | 4.11 | 17.66 | 8.84 | 7.08 | |||
| 1987 | 38.86 | 28.57 | 39.82 | -11.45 | 19.69 | 4.68 | -2.43 | |||
| 1986 | 34.61 | 18.43 | 24.57 | 3.28 | 23.86 | 3.51 | -9.81 | |||
| 1985 | 44.96 | 4.39 | 10.31 | 10.65 | 12.11 | 5.61 | 19.06 | |||
| 1984 | 48.39 | 12.54 | 39.67 | 6.4 | 17.04 | 6.09 | 8.42 | |||
| 1983 | 31.39 | 19.74 | 122.87 | 10.24 | 16.08 | 6.36 | -0.68 | |||
| 1982 | 29.14 | 18.69 | 22.3 | 7.36 | 14.82 | 5.9 | 5.89 | |||
| 1981 | 37.61 | 24.2 | 116.5 | 10.86 | 10.32 | 11.88 | 6.14 | |||
| 1980 | 94.26 | 20.64 | 50.07 | 17.78 | 20.82 | 11.94 | 4.48 | |||
| 1979 | 63.54 | 10.49 | 54.44 | 13.09 | 9.9 | 8.27 | 16.03 | |||
| 1978 | 61.9 | 11.72 | 73.09 | -2.67 | 11.08 | 6.14 | 14.31 | |||
| 1977 | 25.99 | 27.29 | 116.45 | 6.49 | 12.73 | 10.13 | 16.66 | |||
| 1976 | 17.46 | 11.26 | 56.08 | 7.04 | 10.32 | 7.16 | 28.54 | |||
| 1975 | 21.23 | 12.88 | 29.82 | 16.77 | 9.67 | 20.9 | 6.55 | |||
| 1974 | 23.9 | 14.25 | 18.13 | 14.95 | 10.02 | 26.66 | 8.59 | |||
| 1973 | 13.94 | 9.82 | 17.68 | 22.74 | 5.11 | 23.07 | 8.91 | |||
| 1972 | 15.42 | 6.4 | 10.07 | 3.19 | 2.1 | 5.18 | -6.08 | |||
| 1971 | 19.01 | 4.2 | 9.56 | 9.58 | 3.14 | 4.73 | 0.54 | |||
| 1970 | 7.92 | 1.67 | 3.03 | 1.37 | 3.76 | 5.35 | 10.12 | |||
| 1969 | 4.92 | 3.59 | 7.32 | 1.41 | 3.41 | 3.19 | 1.43 | |||
| 1968 | 6.05 | 0.69 | 7.89 | 1.32 | -1.68 | 0.17 | 0.18 | |||
| 1967 | 13.97 | 1.6 | -8.42 | -2.94 | 0.7 | 6.81 | 0.81 | |||
| 1966 | 8.47 | -0.39 | 13.24 | 8.3 | 9.04 | 7.23 | -1.36 | |||
| 1965 | 4.56 | 2.15 | 26.44 | 2.26 | 14.84 | 5.57 | ||||
| 1964 | 1.12 | 3.81 | 9.16 | 3.66 | 4.18 | |||||
| 1963 | 6.36 | 0.37 | 4.31 | 0.75 | 1.46 | |||||
| 1962 | 3.89 | 0.72 | -0.55 | -3 | -0.52 | |||||
| 1961 | 3.17 | 3.16 | 3.78 | 0.69 | 1.64 | |||||
| 1960 | 5.66 | 9.82 | -5.03 | 0.33 | 6.95 | |||||


Comments