
Abstract
Cross-border lending trends have shown significant growth, with the United States consistently leading in lending volumes. In recent years, the US’s dominance in cross-border lending, especially to non-banks, has been notable, with 2023 marking a peak of $1.56 trillion. This growth reflects the global reliance on US financial institutions for capital, influenced by factors like the dollar’s status as the world’s reserve currency and US financial market depth. Historically, lending has expanded as global trade and investment flows increased, with non-bank financial institutions becoming increasingly important players.
Crossborder loans from banks to nonbanks
Cross-border lending from the Bank for International Settlements to non-banks has evolved significantly since 1995. The United States, leading this trend, hit a peak of $1.8 trillion in 2008, driven by global financial integration and high-risk lending during the pre-crisis boom. Today, the US stands at 86.9% of that peak, reflecting both the aftermath of the 2008 financial crisis and shifting global lending dynamics. Non-bank lenders have grown in prominence, with emerging markets increasingly attracting cross-border capital. Trends show a focus on higher-quality borrowers, but volatility remains a key feature.
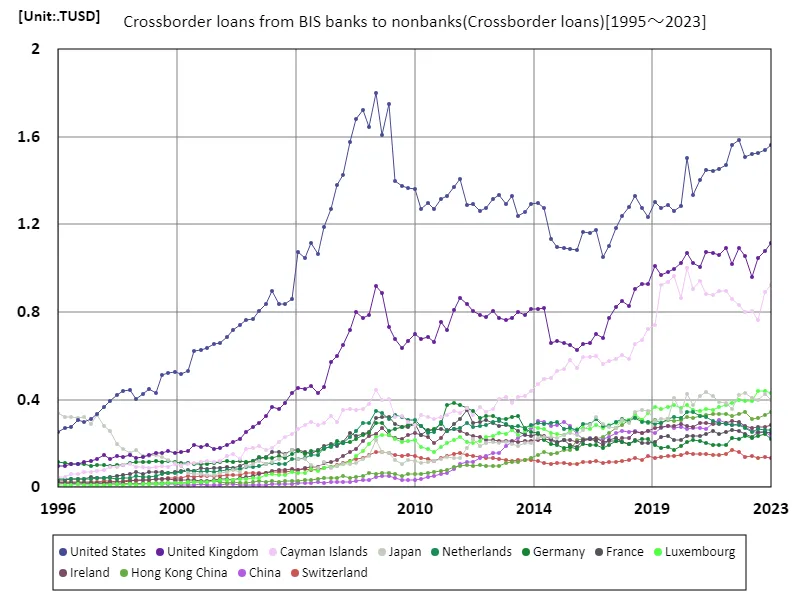
The maximum is 1.8TUSD[2008] of United States, and the current value is about 86.9%
Cross-border loans from bis banks to nonbanks (around the world)
Cross-border lending to non-banks, tracked by the Bank for International Settlements, peaked at $1.8 trillion from the United States in 2008, fueled by global financial growth and riskier lending practices. As of 2023, the US stands at 86.9% of that peak, reflecting the lasting impacts of the 2008 financial crisis and shifting global lending patterns. Non-bank financial institutions have become increasingly significant, especially in emerging markets, driving cross-border capital flows. Despite growth, lending remains influenced by global economic cycles, regulatory changes, and financial stability concerns.
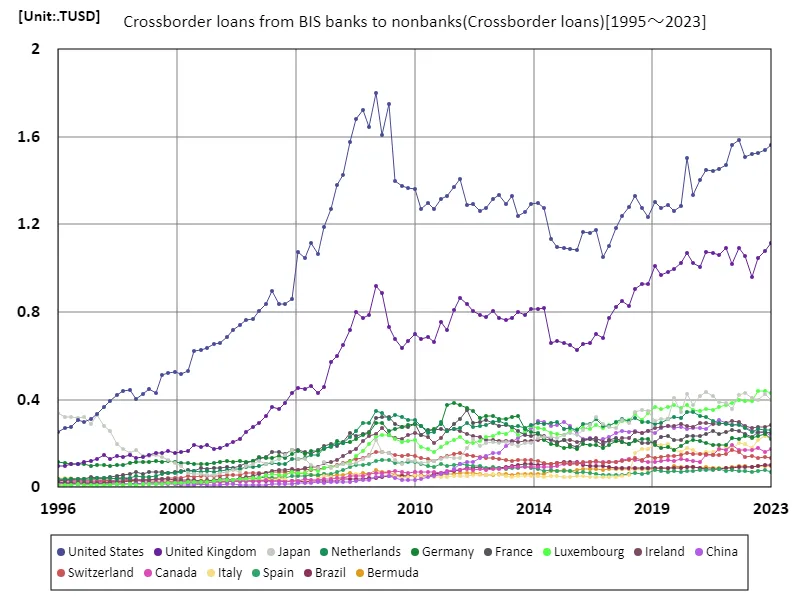
The maximum is 1.8TUSD[2008] of United States, and the current value is about 86.9%
Crossborder loans from bis banks to nonbanks (worldwide, latest year)
Cross-border lending to non-banks, tracked by the Bank for International Settlements, reached its highest level in 2023 at $1.56 trillion from the United States, contributing to a total of $9 trillion globally. The average lending across countries stands at $41.1 billion. This growth reflects increasing global financial integration, with non-bank lenders playing a larger role in capital markets. The United States remains dominant, but lending is diversifying as emerging markets attract more cross-border capital. Trends show a shift toward more selective lending, influenced by economic cycles and regulatory frameworks.
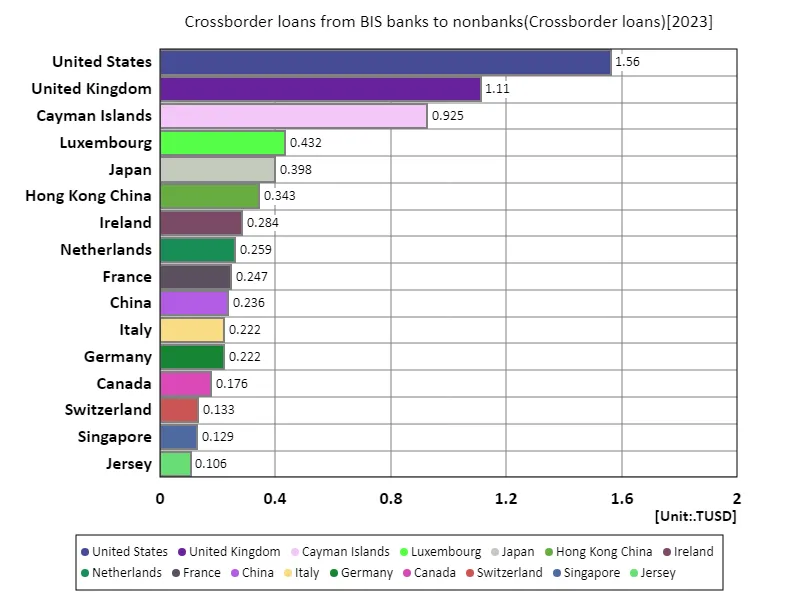
The maximum is 1.56TUSD of United States, the average is 41.1GUSD, and the total is 9TUSD
Crossborder loans from bis banks to nonbanks (worldwide, latest year)
As of 2023.25, cross-border lending to non-banks, tracked by the Bank for International Settlements, totals $7.5 trillion, with the United States leading at $1.56 trillion. The average lending across countries is $38.1 billion. This growth reflects an increasing reliance on non-bank financial institutions for global capital flows, driven by financial market expansion and regulatory changes. While the US remains the dominant lender, emerging markets are attracting a growing share of cross-border funds. Trends indicate a shift toward more cautious lending, influenced by global economic uncertainty and tighter regulations.
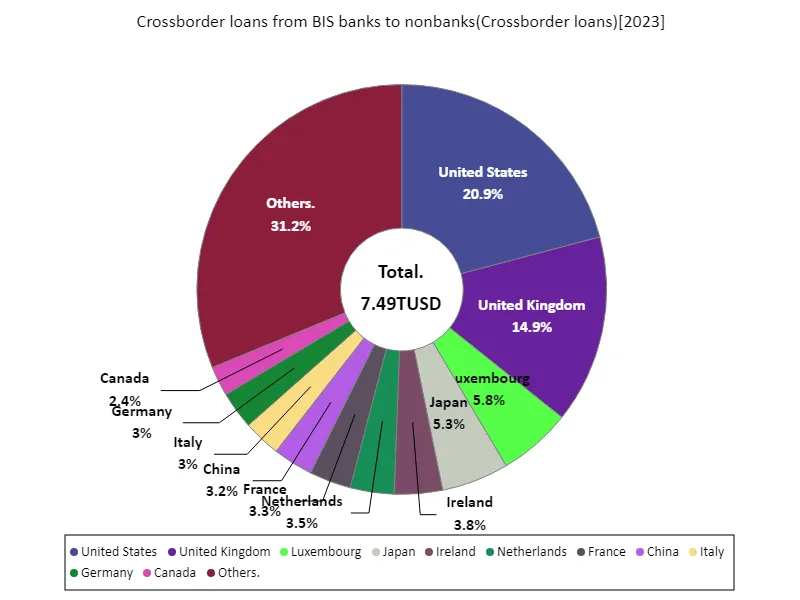
The maximum is 1.56TUSD of United States, the average is 38.4GUSD, and the total is 7.49TUSD


Comments