
Abstract
Global service imports have steadily increased over the past decades, reflecting the growing importance of services in the world economy. From 2000 to 2020, service trade expanded as digitalization, globalization, and technological advances spurred demand for financial, professional, and digital services. The rise in global service imports, reaching 7.21 TUSD in 2023, highlights a shift towards a more services-driven economy, with significant contributions from sectors like IT, finance, tourism, and transport. Economic integration and outsourcing further accelerated these trends.
Service Imports(usd)
Global service imports of goods sold, reaching a peak of 7.21 TUSD in 2023, reflect the increasing integration of services into the global economy. Since 1975, service imports have grown in line with the expansion of international trade, especially in sectors like finance, technology, and logistics. The rise in digital services, e-commerce, and outsourcing has been pivotal in this trend. As economies shifted from manufacturing to service-driven growth, global service trade became more essential, with services now comprising a significant share of total trade flows worldwide.
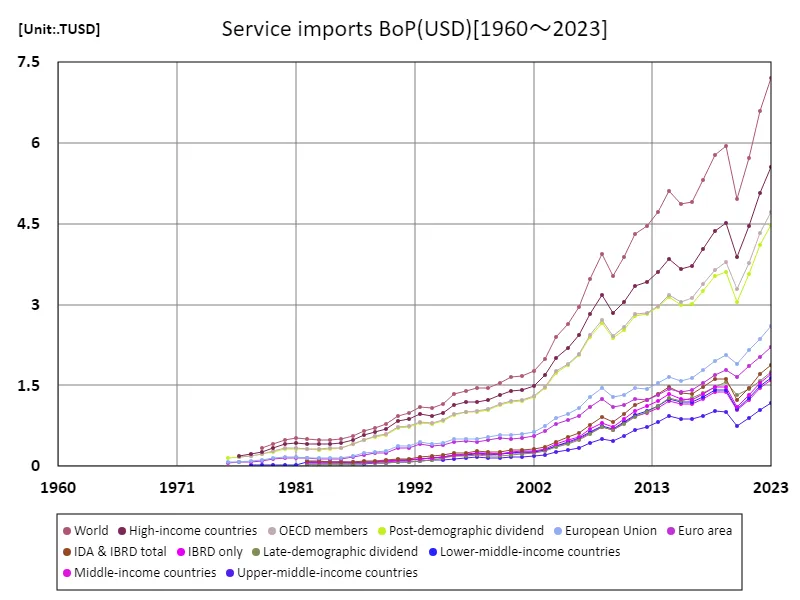
The maximum is the latest one, 7.21TUSD of World
Service Imports (usd) (Worldwide)
U.S. service imports reached a record high of 719 GUSD in 2023, reflecting a broader global trend toward increased service trade. Since 1960, service imports in the U.S. have surged, driven by the growth of sectors like finance, technology, and intellectual property. As the U.S. economy transitioned from manufacturing to a service-oriented model, demand for foreign services—especially in areas like business, information technology, and professional services—expanded. The U.S. remains a major player in global service imports, with technology and digital services now at the forefront of this trade growth.
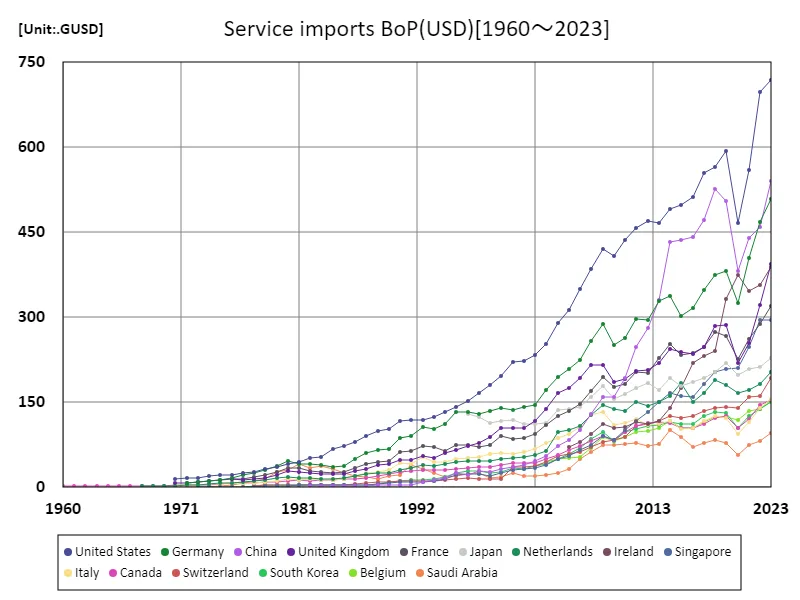
The maximum is the latest one, 719GUSD of United States
Services imports (usd) (World Countries, latest year)
In 2023, the United States led global service imports, reaching a peak of 719 GUSD, a significant contributor to the total global service imports of 6.64 TUSD. The U.S. dominates in sectors like finance, technology, and intellectual property, reflecting its service-oriented economy. The global average stands at 58.3 GUSD, highlighting the disparity in service import volumes across countries. Over time, digitalization, globalization, and the shift towards a service-based economy have driven the growth of international service trade, with advanced economies leading this trend.
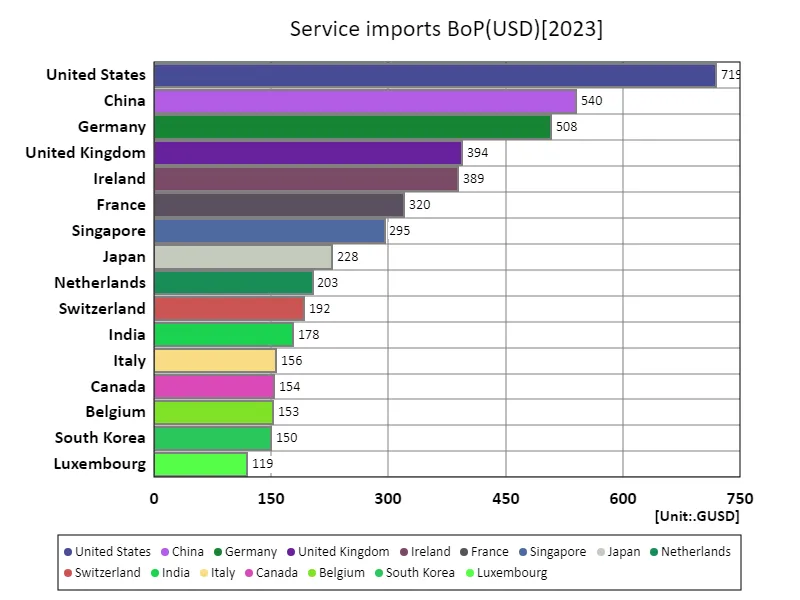
The maximum is 719GUSD of United States, the average is 58.3GUSD, and the total is 6.64TUSD
Services imports (usd) (region, latest year)
In 2023, the European Union led global service imports of goods sold, reaching 2.6 TUSD, a key driver of the total global service imports of 8.58 TUSD. The EU’s high service import volume reflects its strong economic integration, with significant demand for services in sectors like finance, technology, and logistics. The average for other regions stands at 780 GUSD, showing the EU’s dominant position in this trade. Over the years, service imports have surged globally, driven by digitalization, outsourcing, and the shift towards a service-oriented economy, particularly in advanced economies like the EU.
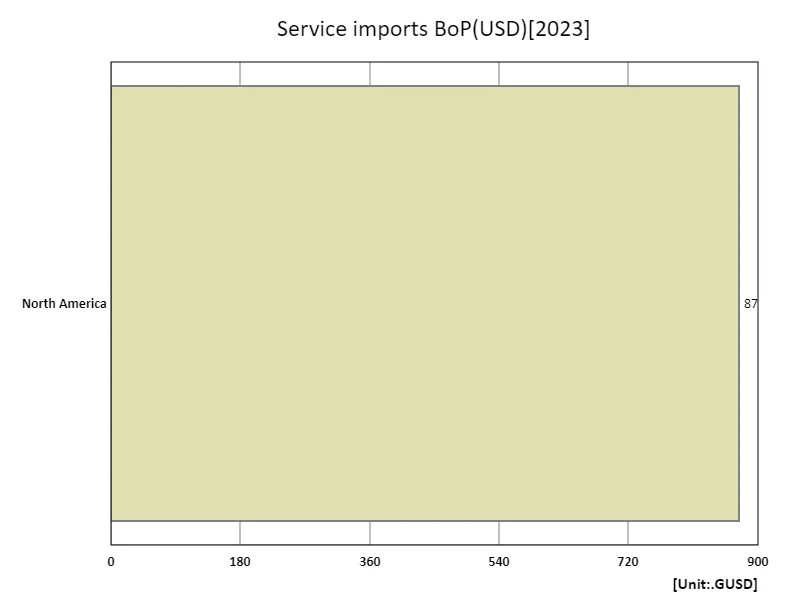
The maximum is 874GUSD of North America, the average is 874GUSD, and the total is 874GUSD


Comments