Abstract
Luxembourg’s imports of goods and services, at 182% of GDP in 2023, highlight its unique economic structure. Historically, Luxembourg has had a high import-to-GDP ratio due to its status as a global financial hub and its reliance on external trade for goods, services, and investment flows. The country’s small domestic market means it depends heavily on imports for consumption and industry. Additionally, its position within the European Union allows for extensive cross-border trade, further amplifying the import ratio. This trend reflects Luxembourg’s open, globalized economy.
Imports of goods and services (percent of GDP)
Hong Kong’s peak imports of goods and services, reaching 221% of GDP in 2013, reflects its role as a global trade and financial hub. As a small, open economy, Hong Kong relies heavily on imports for both consumption and re-export purposes, with its extensive trade networks linked to China and the broader Asia-Pacific region. The decline to 79.4% of its 2013 peak indicates a shift in trade patterns, possibly due to changes in global supply chains and local economic dynamics. Despite this, Hong Kong remains a vital conduit for international trade, especially between China and the rest of the world.
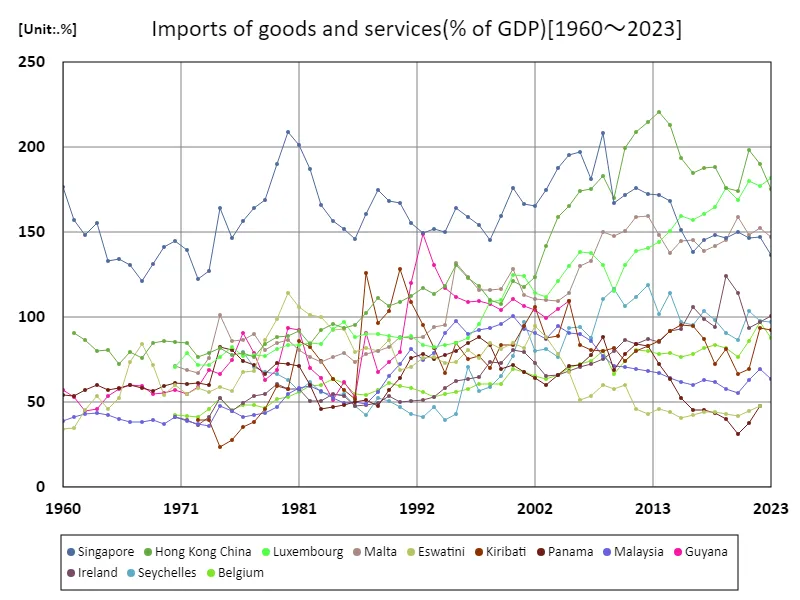

The maximum is 221%[2013] of Hong Kong China, and the current value is about 79.4%
Imports of goods and services (% of GDP) (worldwide)
Singapore’s peak imports of goods and services, reaching 209% of GDP in 1980, underscored its role as a major global trade hub. Its open, export-oriented economy relies heavily on imports for manufacturing, re-exports, and consumption, driven by its strategic location and robust infrastructure. The current figure of 65.5% reflects a shift, possibly due to economic diversification, growth in high-value services, and changes in global trade patterns. Despite this decline, Singapore remains a key player in global trade, leveraging its port and financial sectors to maintain international connectivity.
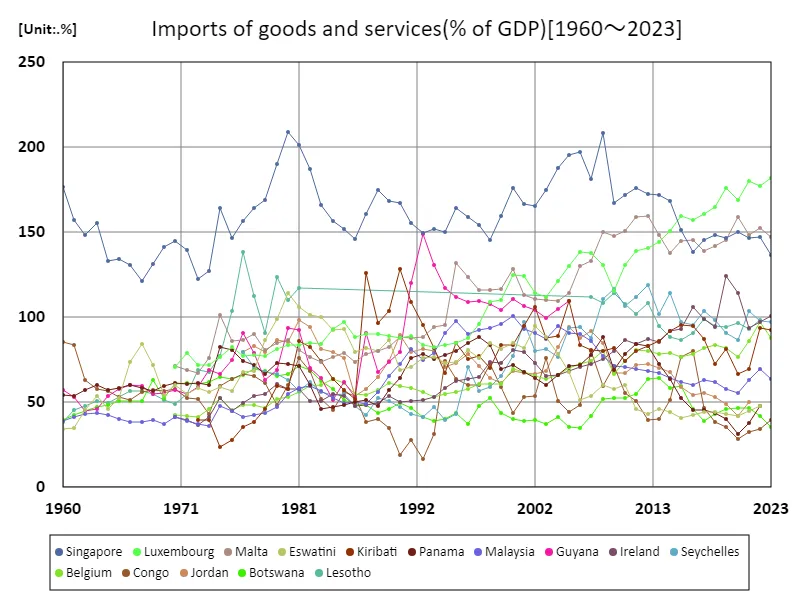

The maximum is 209%[1980] of Singapore, and the current value is about 65.5%
Imports of goods and services (% of GDP) (world countries, latest year)
In 2023, Luxembourg’s imports of goods and services reached 182% of GDP, the highest globally, reflecting its role as a financial hub with a highly open economy. The country’s small domestic market leads to a heavy reliance on imports for consumption and industrial activities. The global average stands at 48.3%, highlighting diverse economies with varying dependence on international trade. Luxembourg’s exceptional import ratio underscores its integration into global supply chains and investment flows, while contrasting with countries with lower import-to-GDP ratios due to more self-sufficient or localized economies.
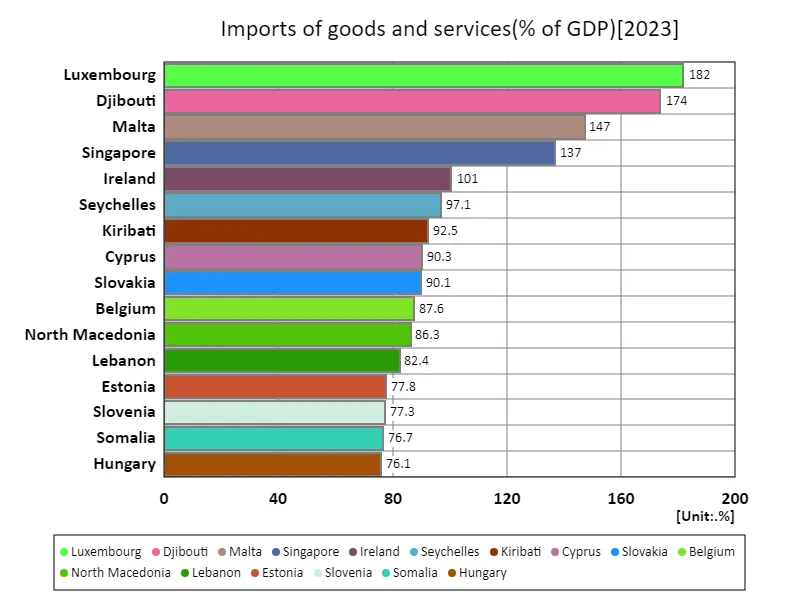

The maximum is 182% of Luxembourg, the average is 48.4%, and the total is 6.49k%
Imports of goods and services (% of GDP) (region, latest year)
In 2023, Central Europe and the Baltics recorded the highest imports of goods and services at 60.1% of GDP, reflecting their open, export-driven economies. These regions rely heavily on trade due to their smaller domestic markets and integration into the European Union’s internal market. The global average stands at 34.2%, with a total import-to-GDP ratio of 377%, indicating that some regions are more dependent on external trade than others. Central Europe and the Baltics’ higher import ratios highlight their strategic position in European supply chains and their economic alignment with broader global trade trends.
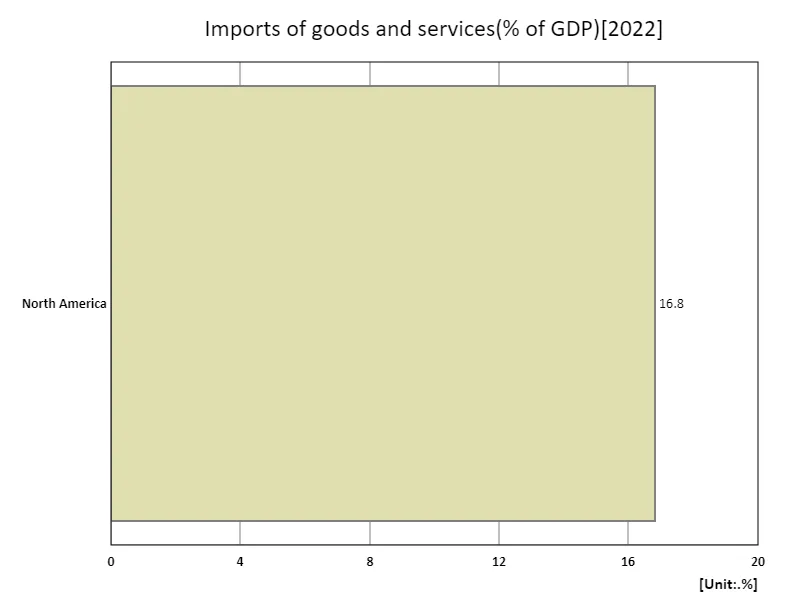

The maximum is 16.8% of North America, the average is 16.8%, and the total is 16.8%


Comments